
Brewers Video
A year ago, MLB introduced a new set of metrics to Statcast that all had something in common: they attempted to quantify the characteristics of every player’s swing. For the first time, even the most casual of baseball fans could look at anyone’s bat speed, fast-swing rate, squared-up rate, number of “blasts,” and swing length.
Following the success of that information being made public, MLB turned up the complexity a notch by adding four more metrics that are even more complex: swing path, attack angle, ideal attack angle rate, and attack direction. This added complexity is cool and can be a neat way to impress your coworkers at the water cooler, but only if you really know what each metric means and how to interpret it. So, let’s walk through what’s being measured for each example.
Swing Path
One of the most notable differences between a golf and a baseball swing is the amount of tilt on the swing. In golf, swings are much steeper, for several reasons (like the fact that the ball is sitting still) which would give the swing greater tilt. In baseball, I’m sure you have great memories of a parent or coach telling you to “level out” your swing in hopes that you’d create a flatter bat path, with lower tilt. To measure this for big leaguers, MLB calculates the angle of the swing in the final 0.4 seconds prior to contact. The MLB average is right around 32°, but some players are more extreme than others, with average tilt ranging from roughly 23˜ to 46°.
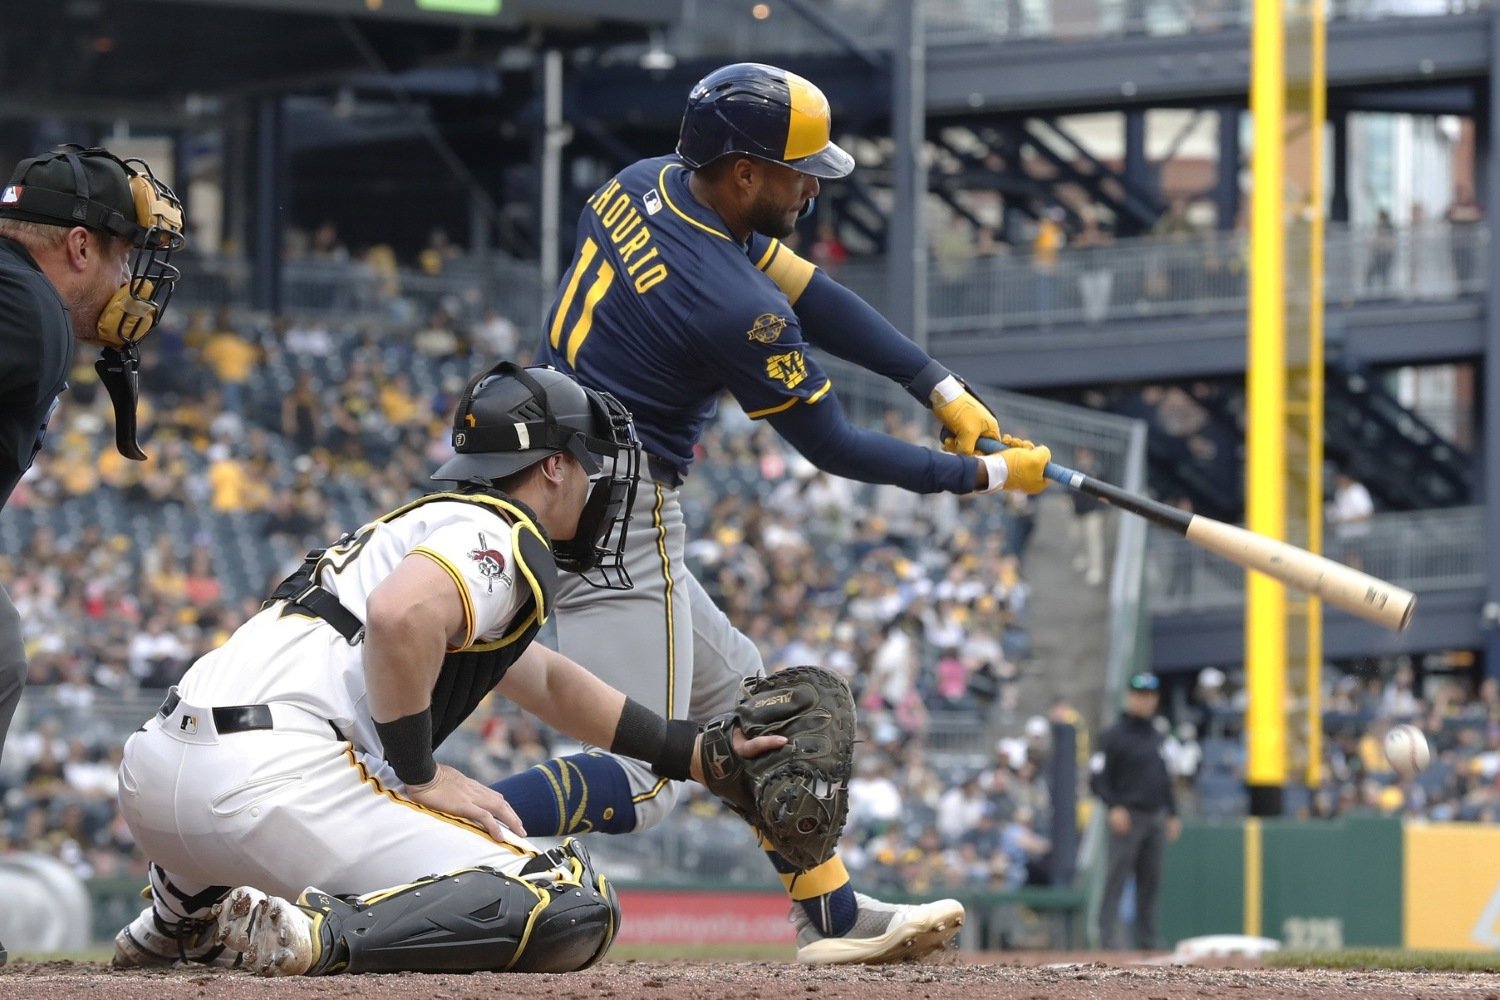
The Brewers must not have a lot of golfers on the club, because for the most part, their players are right around the league-average tilt on their swings. The flattest bat path goes to Jackson Chourio, who has an average swing path tilt of 26 degrees.
While a good high-level glimpse of a player’s approach, it’s an incomplete measurement. First, swings vary immensely depending on where a given pitch is landing. Second, both ends of the swing path spectrum have their pros and cons. Flatter paths help with making contact, but limit the amount of power one can generate. Steeper paths are the opposite. So, like a fantasy football draft, it’s best to be somewhere in the middle.
Attack Angle
The attack angle measures the second part of the swing. While swing path takes into account the arc of the swing, attack angle only measures the vertical angle of the bat right when it hits the ball.
This gives us an idea of where in a given hitter’s swing they typically make contact with the ball. Negative attack angles mean that the player is still swinging down when they hit the ball, whereas a positive attack angle means the player is already in the latter half of their swing. This can also be interpreted as a timing mechanism. If one is late, their attack angle will typically be lower. If one is early, their attack angle will typically be more steep.
Joey Ortiz has an average attack angle of just 3°, quite a bit below the league average of 10°. Like swing path, using a single average number isn’t necessarily the best way to get an accurate look at what a player’s swing looks like, since it may vary widely pitch by pitch, but a very flat average attack angle could be a big reason why Ortiz is struggling to find any semblance of power this year, slugging just .252 over 175 plate appearances. In fact, @Jake McKibbin suggested as much in his recent piece diagnosing a root cause for Ortiz’s deflated offensive performance.
Ideal Attack Angle Percentage
With thousands of swings registered in their database, it didn’t take long for MLB to find that the most productive contact typically happens at attack angles between 5° and 20°. This should make sense, since that’s the angle at which most pitches hit the strike zone, allowing hitters to match the plane most closely with their barrels.
As stated earlier, a single average metric isn’t necessarily a great way to determine how a player attacks pitches, since each individual example can vary wildly. However, a look at how often they’re attacking the ball at a theoretically optimal angle should give you a clearer idea of how well their swing is working. Of course, like launch angle, being in the ideal range can still be hamstrung by a lack of bat speed. Caleb Durbin finds the ideal attack angle roughly 67% of the time but his overall production is held back by bottom percentile exit velocity and bat speed.
Attack Direction
The simplest way to think of attack direction is as the horizontal version of attack angle. It measures the horizontal angle of the bat at the point of contact and, like attack angle, can be used to gauge timing. Earlier hitters will have greater angles to the pull side and later hitters will have the opposite. While it’s generally better to pull the ball because it provides one with access to more power, there are players who find success going the other way as well.
Pitch height also creates variability in attack direction for swings, but that's mostly because higher velocity works best when it's at the top of the zone, while non-fastball pitches work best lower in the zone. Given that higher velocity makes catching up a little harder, it makes sense that one might see more pull-oriented swings against lower pitches and more opposite attack directions at the upper parts of the zone.
Interestingly, Milwaukee’s own Brice Turang currently has the most opposite field-oriented swing in MLB, averaging a horizontal attack angle of 11° going the other way. This matches up with his current positive run value against almost all breaking and off-speed pitches, while he has struggled immensely against fastballs. Rhys Hoskins leads qualified hitters on the team with an attack direction of 6° to the pull side, which could be why he also leads the lineup with a .478 slugging percentage. It should be no surprise that he has crushed fastballs but has struggled more against pitches with movement, the sweeper in particular.
Unlike more traditional metrics like strikeout rate and chase rate, there isn’t a clear “better” or “worse” place to be for these new metrics. It may be preferable to have a more pull-oriented attack direction or hit the ideal attack angle more frequently but it’s far less cut and dry than the simpler measurements. All of this helps break down the nitty gritty details of what a player looks like at the plate and come to a potential diagnosis of what could be the cause of their hot streak or cold stretch.
The best part of all this is that if you're more of an "eye test" fan who believes numbers and high-tech equipment are sullying the national pastime, then you can always feel free to ignore all of this shiny new information. On the other hand, if you find this sort of stuff interesting, MLB seems intent on adding as much data as possible to bring fans closer to the game so there will likely be more information to come. Comprehending the more complex stuff is the hard part but once you get an idea of what it measures and how to interpret it, it can become an integral piece of your own analysis. Either way, whether you're checking swing speeds and attack angles or just happy to enjoy beers and brats at the ol' ballpark, you're a fan of the game.
View our top trade candidates list, up to nearly 70 names and updated regularly!
View Trade Candidates


Recommended Comments
There are no comments to display.
Create an account or sign in to comment
You need to be a member in order to leave a comment
Create an account
Sign up for a new account in our community. It's easy!
Register a new accountSign in
Already have an account? Sign in here.
Sign In Now