

homer
-
Posts
20,306 -
Joined
-
Last visited
-
Days Won
29
Content Type
Profiles
Forums
Blogs
Events
News
2026 Milwaukee Brewers Top Prospects Ranking
Milwaukee Brewers Videos
2022 Milwaukee Brewers Draft Picks
Milwaukee Brewers Free Agent & Trade Rumors, Notes, & Tidbits
Guides & Resources
2023 Milwaukee Brewers Draft Picks
2024 Milwaukee Brewers Draft Picks
The Milwaukee Brewers Players Project
2025 Milwaukee Brewers Draft Pick Tracker
2026 Milwaukee Brewers Draft Pick Tracker
Store
Downloads
Gallery
Everything posted by homer
-
 Oh ok. I don't remember that. I seem to recall the city balking at their portion of the Miller Park funding going towards a proposed taproom of some kind that would have been just east of the stadium but I don't remember Poto discussions.
 -
Komatsu's old plant is right next to the valley (they moved to the Harbor District). There is a ton of room to just create a neighborhood from scratch if they want. But yes they'd need to redo that infrastructure and add some transit in there to make it appealing.
-
Not sure I follow.
-
I can't wait to see what this team looks like once we have a fully armed and operational battle station, er, offense.
-
Miami just scored again
-
LOL
-
This was a fantastic win. The Packers were arguably missing 5 of their top 6 players (Gary being the other one). Some dumb mistakes but it's a really young team. I think they could be very good once they are fully healthy. Hopefully that actually happens at some point this season.
-
the color announcer sucks
-
Short week off and they play DET on Thurs. I get it. Still frustrating.
-
Brewers (Woodruff) vs Marlins (Luzardo): 9/23/23, 3:10pm
homer replied to Brock Beauchamp's topic in Archived Game Threads
Some of the ones they put out are so fast and so on the money. They must have a team of people behind that account -
Brewers (Woodruff) vs Marlins (Luzardo): 9/23/23, 3:10pm
homer replied to Brock Beauchamp's topic in Archived Game Threads
-
I agree with this. Unless NY offers something ridiculous for a manager like $12 million a year he'd be leaving for reasons other than money.
-
It's Whitefish Bay, WI :)
-
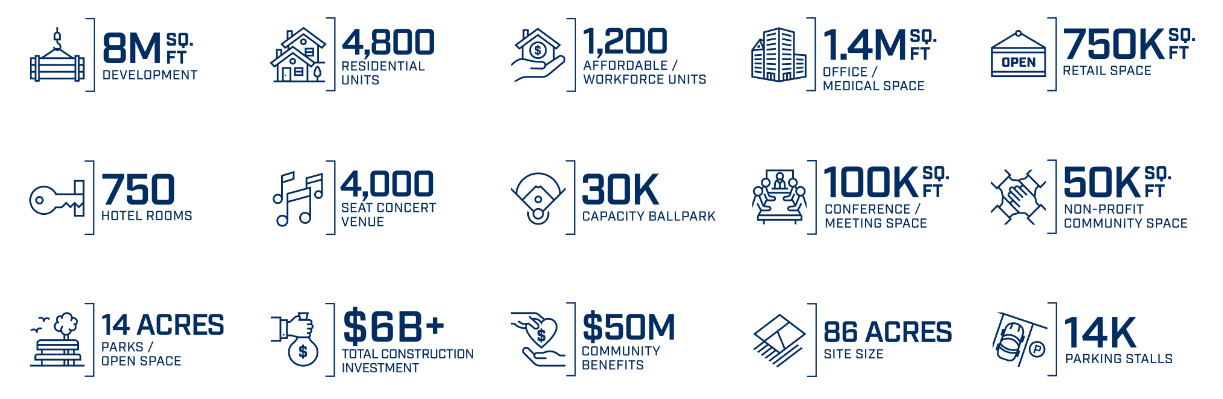
By way of comparison, this is everything that the Rays are squeezing into 86 acres. Am Fam and the surrounding lots take up 265 acres.
-
That's the rub - the Brewers are gaining more from parking lots than development. The city would gain more from development than parking lots. I think the Brewers would probably like to develop some of that land but they want the same tax deal they have now. The vacancy rate for apartments in Milwaukee is 6.6%. Plenty of people would live there. Some mid rise apartments, townhomes along the river, add a hotel, a brewery, office space, etc. What was once a sea of parking is now a lot of buildings. And there's a bunch of retail a mile south of there - it's not as isolated as it looks.
-
Titletown has one bar. I don't think a "Beer District" would have to have a ton in the way of entertainment or bars or restaurants, They could have a mix of residential and commercial. Hank Aaron trail and the river run right through the property which might be attractive to people.
-
Nashville is spending 1.2 billion dollars in public funds on a new football stadium. I suppose it could be retrofitted for baseball but that would probably not be ideal for a team moving in. So then you're looking at another funding deal to build a new baseball stadium.... would the city pony up?
-
I think they can only raise the temp 30 degrees from the outside temp. So presumably winterize means raising it to whatever it needs to be.
-
I think building parking structures largely addresses that issue. You probably have the same amount of parking spots they just take up less land. I think the fact that people can drive two hours and are guaranteed a game rain or shine is what helps attendance the most.
-
It's probably not his call. The Brewers must think they can make more money off of parking (and not paying property taxes on those lots) than they can via development.
-
I get that tailgating is big thing but how many people tailgate per game? Is it even 50%?
-
I was going to mention the player payroll as that was used to help finance Fiserv.
-
I think it's different when the "if" plays are self inflicted goofs. The field goal that turned into a punt because they got a delay of game penalty and Love not knowing the snap count on the sneak are examples.


