

BruisedCrew
-
Posts
8,740 -
Joined
-
Last visited
-
Days Won
8
Content Type
Profiles
Forums
Blogs
Events
News
2026 Milwaukee Brewers Top Prospects Ranking
Milwaukee Brewers Videos
2022 Milwaukee Brewers Draft Picks
Milwaukee Brewers Free Agent & Trade Rumors, Notes, & Tidbits
Guides & Resources
2023 Milwaukee Brewers Draft Picks
2024 Milwaukee Brewers Draft Picks
The Milwaukee Brewers Players Project
2025 Milwaukee Brewers Draft Pick Tracker
2026 Milwaukee Brewers Draft Tracker: Picks & Bonuses
Store
Downloads
Gallery
Everything posted by BruisedCrew
-
Always nice to complete a series win with a quick, stress free win.
-
So now you’re changing your tune and saying it ISN’T “incredibly hard” to find an example. If there are “infinitely” more examples of teams holding leads like this, then why isn’t the probability effectively 100%. If the Brewers probability of winning the division is 98% that should mean that there are 49 (not an infinite number) examples of teams prevailing for every 1 that doesn’t. Or are you saying that a 98% chance of winning a division is somehow different than the 98% chance of winning a game.Or that the 98% chance of winning the division is really understated? Just because someone RECOGNIZES the worst case scenario doesn’t mean he isn’t enjoying the current situation or persistently worrying about the worst case scenario. But, as others have said, I’m not sure why you persistently criticize people who take a different approach to things than you do. Why the heck do you care?
-
It is not incredibly hard because all I have to do is pull things from my memories of following baseball for almost 70 years and then use Baseball Reference to provide the details. One of those memories involves the Mariners and Angels in 1995. That was a season that started a little late after the labor dispute that wiped out the last half of the 1994 season and the playoffs. On August 20, the Mariners with a record of 53-53 were in third place 12.5 games behind the Angels, who led the second place Rangers by 9 games. The Mariners only had 2 remaining games against the Angels. Angels fans were probably thinking that all the Angels had to do was play .500 ball in their remaining 37 games and they would be in the playoffs. What happened was that the Mariners went 25-13 the rest of the way (splitting their 2 games with the Angels):while the Angels went 12-25 and the teams ended up tied. The Mariners beat the Angels 9-1 in a playoff to win the division. This is just one example. It can happen and it has happened, so people who remember it are going to be wary of something similar happening to their teams, even if it has a low probability, like losing a game after leading 10-3 in the seventh inning
-
I wasn’t at all concerned during the late innings last night. After Peralta finished the 6th inning the Brewers win probability was 97% so the game was effectively over.
-
Brewers bullpen breaking out its Pirates imitation
-
Don’t blink or you missed five runs
-
Never once did I say that this was probable or that I was fretting over it. But, when you have seen it before, you really don’t want to see it again and you don’t want to see it getting started. I never said anything about the Brewers losing the entire lead. I was talking about it getting close enough to make it a little uncomfortable.
-
That wasn’t me. I didn’t “supposedly” state facts. I really did state them. It wouldn’t be hard to find examples of teams that gained 6 games in the standings in 2 weeks without the benefit of head to head games against the team they were chasing. I was just citing a recent example that illustrates how quickly things can change. If the Brewers lose 13 of 14 like they did in late August and early September of 2014 after leading the division most of the season they would be opening the door for a team to catch them without the playing the Brewers head to head.
-
After facing the Nats and Pirates in their next two series the Cubs will be playing the Yankees and Dodgers.
-
Who said I was “fearful”? I’m just stating facts. Trying to read minds again? At least you agree that the Brewers have to win games. That’s all I’m looking for.
-
We’ve just seen the Royals come from 6 games back 2 weeks ago to move into a tie with Cleveland. (They fell a game back with a loss today), I think it’s fair to say that the Brewers need to keep winning at a respectable pace to guarantee that the race doesn’t get closer than anyone would like it to be.
-
Cubs scored 41 runs in the 3 games.
-
Cubs scored 41 runs in the 3 games.
-
Giants (Webb) vs Brewers (Myers): 8/27/24, 7:10pm
BruisedCrew replied to Brock Beauchamp's topic in Archived Game Threads
I miss baseball reference having these charts, but does anyone know how many times the Brewers have won this year when trailing after eight innings? I know the Brewers have a lot of “comeback wins“ but it seems like most of those are small deficits early in the game and not so much coming back in the ninth. -
Giants (Webb) vs Brewers (Myers): 8/27/24, 7:10pm
BruisedCrew replied to Brock Beauchamp's topic in Archived Game Threads
The call had to stand on Perkins catch, but I’m not convinced that ball didn’t squirt out of his glove just enough that the wall helped him pull it in. -
Giants (Webb) vs Brewers (Myers): 8/27/24, 7:10pm
BruisedCrew replied to Brock Beauchamp's topic in Archived Game Threads
Craigtember is coming. 😀 -
Immaculate Grid Daily Basball Trivia
BruisedCrew replied to wiguy94's topic in Milwaukee Brewers Talk
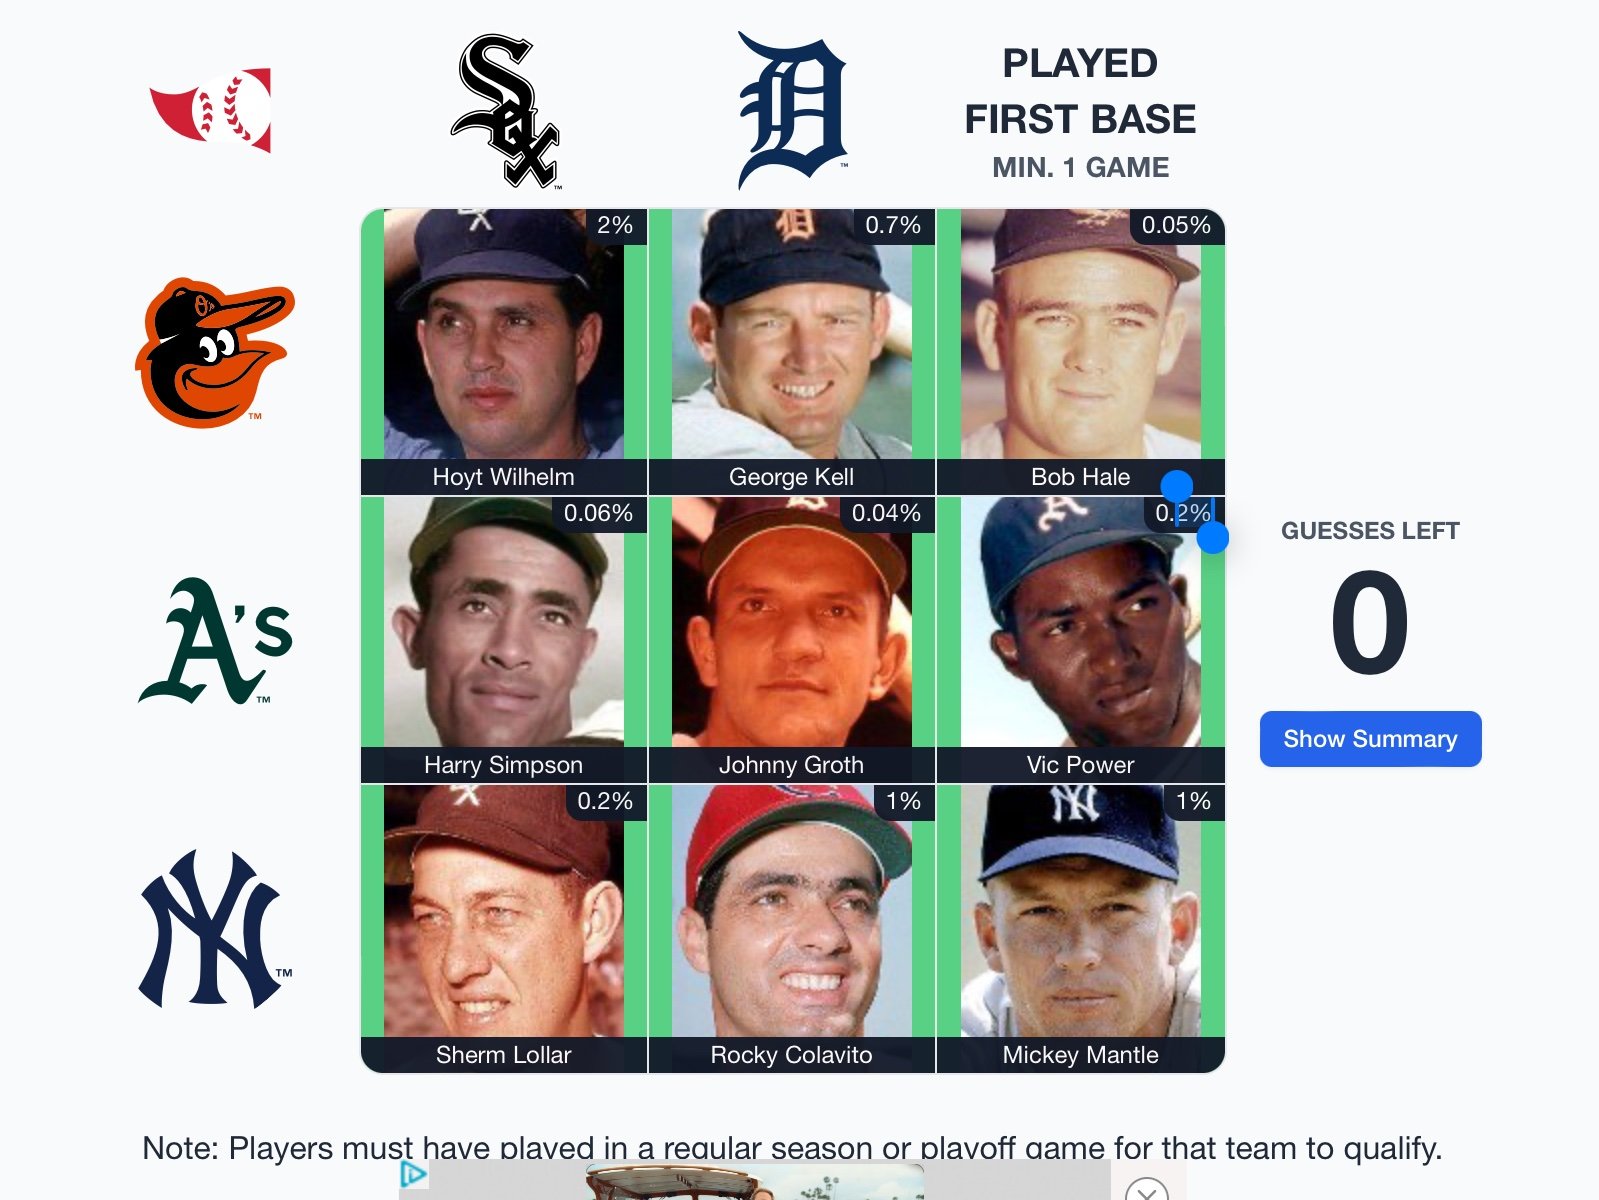
-
Immaculate Grid Daily Basball Trivia
BruisedCrew replied to wiguy94's topic in Milwaukee Brewers Talk
Using knowledge from my baseball cards of the late 50’s I was able to set a personal record today with a Rarity Score of 6. -
Brewers (Montas) vs A's (Estes): 8/25/24, 3:07pm
BruisedCrew replied to treego14's topic in Archived Game Threads
Never mind. What I wanted to say about the first sentence of this post is better left unsaid. -
Brewers (Rea) vs A's (Boyle): 8/24/24, 3:07pm
BruisedCrew replied to Brock Beauchamp's topic in Archived Game Threads
The baseline is whatever line the runner takes to a base. (There is a special rule relating to the running lane from home to first..) A runner is only out for running out of the baseline if he leaves the line to avoid a tag. That doesn’t apply to that play. Runners taking a line that puts them in the path of a potential throw is common and not prohibited. -
Brewers (Rea) vs A's (Boyle): 8/24/24, 3:07pm
BruisedCrew replied to Brock Beauchamp's topic in Archived Game Threads
If they overturn this it would be a travesty. The last one was closer. -
Brewers (Rea) vs A's (Boyle): 8/24/24, 3:07pm
BruisedCrew replied to Brock Beauchamp's topic in Archived Game Threads
Are they “giving” him a day or is he physically unable to go? -
It’s a good thing there aren’t any sub .500 teams in the playoffs. The Brewers seem to have a lot of trouble with them lately.
-
You have your answer.
-
This offense has been pretty crappy since the first 3 innings of the first game of the Reds series. It’s amazing that the Brewers have been able to win as many as they have in this stretch.


