

Jason Wang
-
Posts
930 -
Joined
-
Last visited
-
Days Won
1
Content Type
Profiles
Forums
Blogs
Events
News
2026 Milwaukee Brewers Top Prospects Ranking
Milwaukee Brewers Videos
2022 Milwaukee Brewers Draft Picks
Milwaukee Brewers Free Agent & Trade Rumors, Notes, & Tidbits
Guides & Resources
2023 Milwaukee Brewers Draft Picks
2024 Milwaukee Brewers Draft Picks
The Milwaukee Brewers Players Project
2025 Milwaukee Brewers Draft Pick Tracker
2026 Milwaukee Brewers Draft Pick Tracker
Store
Downloads
Gallery
Everything posted by Jason Wang
-
 He's either talking about when he forged divorce documents in Venezuela OR that he has a slightly unkempt beard but not really sure which one to be honest 🤔
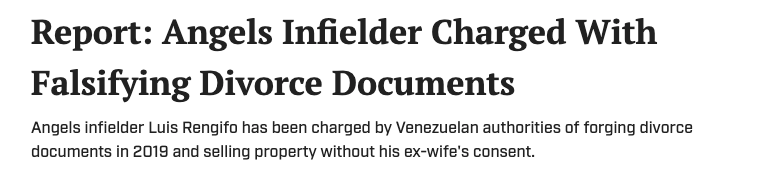
-
Image courtesy of © Charles LeClaire / David Richard - Imagn Images Milwaukee and Cleveland have a lot in common. They’re both in what many coastal dwellers would deem “flyover states." They both sit on the shores of one of the Great Lakes, where they became major hubs of commerce because of their ports. Both cities have seen their populations stagnate or shrink, relative to other big cities, as the things that powered their economies have been made obsolete or changed in such major ways that they no longer dominate the marketplace, but neither absorbed quite as hard a punch as Detroit and Pittsburgh did at the end of the 20th century and beginning of the 21st. They're tough, proud Midwestern towns. They have even more similarities when it comes to baseball. Both teams have found consistent regular-season success despite operating on a shoestring budget, but have failed to make deep runs. Neither city has won a World Series since color television was introduced to U.S. markets. The now-Guardians last won in 1948; Milwaukee hasn't seen a champion since before the Brewers came to town. However, one thing the Guardians have that the Brewers don’t is a player on a Hall of Fame track who will likely wear but one jersey for his entire career. Last week, José Ramírez agreed to an extension that will keep him under club control until 2032, his age-40 season. This is the third extension he has signed with the club, but given his consistently incredible production, it’s no wonder that Cleveland wanted to keep him around for the long haul. His $18.36-million salary in 2026 (it's $25 million, technically, but he'll receive just $15 million of it this year, and the deferral structure of the rest dramatically reduces its value) currently represents roughly 24% of the Guardians’ total payroll, which is more of an indictment of just how little the franchise spends than it is evidence that he’s being overpaid. The team’s current 40-man payroll of $76.2 million pales in comparison to the Brewers’ $123.5 million, which means that if they wanted to, Milwaukee could make a similar move. The Brewers are no stranger to getting ahead of the curve when it comes to locking down promising talent on team-friendly terms. In 2023, Jackson Chourio signed an eight-year, $82-million extension, the largest in history for a player yet to debut. Before the 2020 season, Freddy Peralta signed a five-year, $15.5-million extension with club options. Aaron Ashby signed a very similar deal, for slightly more money over the same span. None of these contracts quite stack up to Ramírez’s deal. Ashby has been held back by injury, Peralta was traded to the Mets this offseason, and Chourio could be a Brewer for life, but since he’ll be 30 years old when the final club option expires, there’s a chance he gets another long-term deal in free agency. Signing Chourio to that early deal did give the team both leverage and goodwill with him, and maybe they can convert that to tangible value by going to him with an offer for another extension in a few years, before the end of his current deal is really in sight. That's what's worked for the Guardians and Ramírez, but there's no guarantee that it will work the same way with Chourio. If none of these three will end up being Milwaukee’s Brewer for Life, are there other candidates for the role? On the current big-league roster, the answer is probably no. There simply isn’t enough compelling talent on a Hall of Fame trajectory (at least not yet) to justify it. The closest candidate might be Brice Turang, who has been one of the squad’s most valuable assets over the past two years. An extension may be in his near future, but he’ll likely hit the free market at least once before hanging up the cleats, especially if his production remains consistently strong. He's not terribly dissimilar to the player Ramírez was at the same stage in his career, when Cleveland first captured his long-term upside with a Peralta-like deal, but Turang has already made almost $7 million in professional baseball, not to mention the $4.15 million he'll earn on the deal he and the team have already struck for 2026. When Ramírez signed his first deal, he had made less than $1.5 million, and unlike Turang, his dad was not a former big-leaguer, so the promise of an eight-figure payday made a much bigger difference in his life. There’s more hope in the farm system. If anyone currently in the organization has a chance of being the next franchise player, it’s one of the Brewers’ top two prospects. Both Luis Peña (MLB No. 18 overall prospect) and Jesús Made (No. 4) already have considerable hype, despite neither player being 20 years old. Luis Peña signed for $800,000 in the 2024 class of international free agents and was exceptional in the 2024 Dominican Summer League, posting a 177 wRC+ and winning the batting title with a .393 average. He also stole 39 bases in just 44 games, making the most out of his 70-grade speed. His numbers were more modest in his first full season in the minor leagues, posting a 139 wRC+ in Low A but struggling to a 42 wRC+ over 109 plate appearances in High A. At 19 years old, he has plenty of time to develop, but there’s too much uncertainty to warrant an extension at this time. More plate appearances against higher-level competition will give us a better idea of how his game will adapt over time. Because his biggest strength is arguably his speed, we'll need more time to evaluate whether he can remain valuable into his late 20s and his 30s, once he loses a step. Made was a part of the same international free agent class as Peña, and got a bigger signing bonus ($950,000). Although he’s slightly younger, he dominated High A last year, posting a 157 wRC+ across 123 plate appearances, resulting in a short stint at Double-A Biloxi. He had a 12.8% walk rate across all levels of the minor leagues, but struggled to hit for power, posting an underwhelming .128 ISO. Although he didn’t get a chance to put his pop on full display, Made is an immensely well-rounded talent. He has few weaknesses in his game. His defensive flexibility is a strength, but the current goal seems to be to keep him at shortstop. If he stays the course, the offensive upside he brings to a premium defensive position could be too good to pass up. Ramírez debuted in 2013, at age 20, and by the time he was 24, he signed his first five-year deal for just $26 million. His style of play and versatile profile have allowed him to maintain a consistent level of production over his 13-year career, and he hasn’t shown any signs of slowing down yet. As things stand, Made is the closest comparison to him within the Brewers system. Like Ramírez, Made is toolsy and already off to a hot start as a baseball professional. Like Ramírez, Made won’t get a lifetime extension off the bat; he'd have to earn it and decide to embrace the community multiple times. For a team with Milwaukee’s spending habits, getting a true franchise player is something most fans can only dream of. Christian Yelich is the closest thing the organization currently has, and he spent several of his best years in Miami. Even once you find that guy, when you play in the league's smallest media market, he has to want to be around for the long haul. Ramírez only got $50,000 when he first signed out of the Dominican Republic, so locking him up on that first contract was easy. With each of the last two, though, Cleveland has gotten very lucky—and has been rewarded for very good relationship-building. Ramírez loves the organization and the city, and he's agreed to deals he knew were less lucrative than ones he could have found elsewhere. If a player is ever going to have a Ramírez-like Brewers tenure spanning their entire career, it will have to be because they, too, have fallen so in love with the team, the city and the fans that they would eschew tens of millions to stay. That could be Chourio, Turang, Made or Peña, but the truth is that it's unlikely to happen at all—even in a city so significantly similar to the one where it's happening now. View full article
- 5 replies
-
- 1
-

-
- jackson chourio
- brice turang
- (and 3 more)
-
.png.317486a52585d8361e8143a012e76386.png) Milwaukee and Cleveland have a lot in common. They’re both in what many coastal dwellers would deem “flyover states." They both sit on the shores of one of the Great Lakes, where they became major hubs of commerce because of their ports. Both cities have seen their populations stagnate or shrink, relative to other big cities, as the things that powered their economies have been made obsolete or changed in such major ways that they no longer dominate the marketplace, but neither absorbed quite as hard a punch as Detroit and Pittsburgh did at the end of the 20th century and beginning of the 21st. They're tough, proud Midwestern towns. They have even more similarities when it comes to baseball. Both teams have found consistent regular-season success despite operating on a shoestring budget, but have failed to make deep runs. Neither city has won a World Series since color television was introduced to U.S. markets. The now-Guardians last won in 1948; Milwaukee hasn't seen a champion since before the Brewers came to town. However, one thing the Guardians have that the Brewers don’t is a player on a Hall of Fame track who will likely wear but one jersey for his entire career. Last week, José Ramírez agreed to an extension that will keep him under club control until 2032, his age-40 season. This is the third extension he has signed with the club, but given his consistently incredible production, it’s no wonder that Cleveland wanted to keep him around for the long haul. His $18.36-million salary in 2026 (it's $25 million, technically, but he'll receive just $15 million of it this year, and the deferral structure of the rest dramatically reduces its value) currently represents roughly 24% of the Guardians’ total payroll, which is more of an indictment of just how little the franchise spends than it is evidence that he’s being overpaid. The team’s current 40-man payroll of $76.2 million pales in comparison to the Brewers’ $123.5 million, which means that if they wanted to, Milwaukee could make a similar move. The Brewers are no stranger to getting ahead of the curve when it comes to locking down promising talent on team-friendly terms. In 2023, Jackson Chourio signed an eight-year, $82-million extension, the largest in history for a player yet to debut. Before the 2020 season, Freddy Peralta signed a five-year, $15.5-million extension with club options. Aaron Ashby signed a very similar deal, for slightly more money over the same span. None of these contracts quite stack up to Ramírez’s deal. Ashby has been held back by injury, Peralta was traded to the Mets this offseason, and Chourio could be a Brewer for life, but since he’ll be 30 years old when the final club option expires, there’s a chance he gets another long-term deal in free agency. Signing Chourio to that early deal did give the team both leverage and goodwill with him, and maybe they can convert that to tangible value by going to him with an offer for another extension in a few years, before the end of his current deal is really in sight. That's what's worked for the Guardians and Ramírez, but there's no guarantee that it will work the same way with Chourio. If none of these three will end up being Milwaukee’s Brewer for Life, are there other candidates for the role? On the current big-league roster, the answer is probably no. There simply isn’t enough compelling talent on a Hall of Fame trajectory (at least not yet) to justify it. The closest candidate might be Brice Turang, who has been one of the squad’s most valuable assets over the past two years. An extension may be in his near future, but he’ll likely hit the free market at least once before hanging up the cleats, especially if his production remains consistently strong. He's not terribly dissimilar to the player Ramírez was at the same stage in his career, when Cleveland first captured his long-term upside with a Peralta-like deal, but Turang has already made almost $7 million in professional baseball, not to mention the $4.15 million he'll earn on the deal he and the team have already struck for 2026. When Ramírez signed his first deal, he had made less than $1.5 million, and unlike Turang, his dad was not a former big-leaguer, so the promise of an eight-figure payday made a much bigger difference in his life. There’s more hope in the farm system. If anyone currently in the organization has a chance of being the next franchise player, it’s one of the Brewers’ top two prospects. Both Luis Peña (MLB No. 18 overall prospect) and Jesús Made (No. 4) already have considerable hype, despite neither player being 20 years old. Luis Peña signed for $800,000 in the 2024 class of international free agents and was exceptional in the 2024 Dominican Summer League, posting a 177 wRC+ and winning the batting title with a .393 average. He also stole 39 bases in just 44 games, making the most out of his 70-grade speed. His numbers were more modest in his first full season in the minor leagues, posting a 139 wRC+ in Low A but struggling to a 42 wRC+ over 109 plate appearances in High A. At 19 years old, he has plenty of time to develop, but there’s too much uncertainty to warrant an extension at this time. More plate appearances against higher-level competition will give us a better idea of how his game will adapt over time. Because his biggest strength is arguably his speed, we'll need more time to evaluate whether he can remain valuable into his late 20s and his 30s, once he loses a step. Made was a part of the same international free agent class as Peña, and got a bigger signing bonus ($950,000). Although he’s slightly younger, he dominated High A last year, posting a 157 wRC+ across 123 plate appearances, resulting in a short stint at Double-A Biloxi. He had a 12.8% walk rate across all levels of the minor leagues, but struggled to hit for power, posting an underwhelming .128 ISO. Although he didn’t get a chance to put his pop on full display, Made is an immensely well-rounded talent. He has few weaknesses in his game. His defensive flexibility is a strength, but the current goal seems to be to keep him at shortstop. If he stays the course, the offensive upside he brings to a premium defensive position could be too good to pass up. Ramírez debuted in 2013, at age 20, and by the time he was 24, he signed his first five-year deal for just $26 million. His style of play and versatile profile have allowed him to maintain a consistent level of production over his 13-year career, and he hasn’t shown any signs of slowing down yet. As things stand, Made is the closest comparison to him within the Brewers system. Like Ramírez, Made is toolsy and already off to a hot start as a baseball professional. Like Ramírez, Made won’t get a lifetime extension off the bat; he'd have to earn it and decide to embrace the community multiple times. For a team with Milwaukee’s spending habits, getting a true franchise player is something most fans can only dream of. Christian Yelich is the closest thing the organization currently has, and he spent several of his best years in Miami. Even once you find that guy, when you play in the league's smallest media market, he has to want to be around for the long haul. Ramírez only got $50,000 when he first signed out of the Dominican Republic, so locking him up on that first contract was easy. With each of the last two, though, Cleveland has gotten very lucky—and has been rewarded for very good relationship-building. Ramírez loves the organization and the city, and he's agreed to deals he knew were less lucrative than ones he could have found elsewhere. If a player is ever going to have a Ramírez-like Brewers tenure spanning their entire career, it will have to be because they, too, have fallen so in love with the team, the city and the fans that they would eschew tens of millions to stay. That could be Chourio, Turang, Made or Peña, but the truth is that it's unlikely to happen at all—even in a city so significantly similar to the one where it's happening now.
Milwaukee and Cleveland have a lot in common. They’re both in what many coastal dwellers would deem “flyover states." They both sit on the shores of one of the Great Lakes, where they became major hubs of commerce because of their ports. Both cities have seen their populations stagnate or shrink, relative to other big cities, as the things that powered their economies have been made obsolete or changed in such major ways that they no longer dominate the marketplace, but neither absorbed quite as hard a punch as Detroit and Pittsburgh did at the end of the 20th century and beginning of the 21st. They're tough, proud Midwestern towns. They have even more similarities when it comes to baseball. Both teams have found consistent regular-season success despite operating on a shoestring budget, but have failed to make deep runs. Neither city has won a World Series since color television was introduced to U.S. markets. The now-Guardians last won in 1948; Milwaukee hasn't seen a champion since before the Brewers came to town. However, one thing the Guardians have that the Brewers don’t is a player on a Hall of Fame track who will likely wear but one jersey for his entire career. Last week, José Ramírez agreed to an extension that will keep him under club control until 2032, his age-40 season. This is the third extension he has signed with the club, but given his consistently incredible production, it’s no wonder that Cleveland wanted to keep him around for the long haul. His $18.36-million salary in 2026 (it's $25 million, technically, but he'll receive just $15 million of it this year, and the deferral structure of the rest dramatically reduces its value) currently represents roughly 24% of the Guardians’ total payroll, which is more of an indictment of just how little the franchise spends than it is evidence that he’s being overpaid. The team’s current 40-man payroll of $76.2 million pales in comparison to the Brewers’ $123.5 million, which means that if they wanted to, Milwaukee could make a similar move. The Brewers are no stranger to getting ahead of the curve when it comes to locking down promising talent on team-friendly terms. In 2023, Jackson Chourio signed an eight-year, $82-million extension, the largest in history for a player yet to debut. Before the 2020 season, Freddy Peralta signed a five-year, $15.5-million extension with club options. Aaron Ashby signed a very similar deal, for slightly more money over the same span. None of these contracts quite stack up to Ramírez’s deal. Ashby has been held back by injury, Peralta was traded to the Mets this offseason, and Chourio could be a Brewer for life, but since he’ll be 30 years old when the final club option expires, there’s a chance he gets another long-term deal in free agency. Signing Chourio to that early deal did give the team both leverage and goodwill with him, and maybe they can convert that to tangible value by going to him with an offer for another extension in a few years, before the end of his current deal is really in sight. That's what's worked for the Guardians and Ramírez, but there's no guarantee that it will work the same way with Chourio. If none of these three will end up being Milwaukee’s Brewer for Life, are there other candidates for the role? On the current big-league roster, the answer is probably no. There simply isn’t enough compelling talent on a Hall of Fame trajectory (at least not yet) to justify it. The closest candidate might be Brice Turang, who has been one of the squad’s most valuable assets over the past two years. An extension may be in his near future, but he’ll likely hit the free market at least once before hanging up the cleats, especially if his production remains consistently strong. He's not terribly dissimilar to the player Ramírez was at the same stage in his career, when Cleveland first captured his long-term upside with a Peralta-like deal, but Turang has already made almost $7 million in professional baseball, not to mention the $4.15 million he'll earn on the deal he and the team have already struck for 2026. When Ramírez signed his first deal, he had made less than $1.5 million, and unlike Turang, his dad was not a former big-leaguer, so the promise of an eight-figure payday made a much bigger difference in his life. There’s more hope in the farm system. If anyone currently in the organization has a chance of being the next franchise player, it’s one of the Brewers’ top two prospects. Both Luis Peña (MLB No. 18 overall prospect) and Jesús Made (No. 4) already have considerable hype, despite neither player being 20 years old. Luis Peña signed for $800,000 in the 2024 class of international free agents and was exceptional in the 2024 Dominican Summer League, posting a 177 wRC+ and winning the batting title with a .393 average. He also stole 39 bases in just 44 games, making the most out of his 70-grade speed. His numbers were more modest in his first full season in the minor leagues, posting a 139 wRC+ in Low A but struggling to a 42 wRC+ over 109 plate appearances in High A. At 19 years old, he has plenty of time to develop, but there’s too much uncertainty to warrant an extension at this time. More plate appearances against higher-level competition will give us a better idea of how his game will adapt over time. Because his biggest strength is arguably his speed, we'll need more time to evaluate whether he can remain valuable into his late 20s and his 30s, once he loses a step. Made was a part of the same international free agent class as Peña, and got a bigger signing bonus ($950,000). Although he’s slightly younger, he dominated High A last year, posting a 157 wRC+ across 123 plate appearances, resulting in a short stint at Double-A Biloxi. He had a 12.8% walk rate across all levels of the minor leagues, but struggled to hit for power, posting an underwhelming .128 ISO. Although he didn’t get a chance to put his pop on full display, Made is an immensely well-rounded talent. He has few weaknesses in his game. His defensive flexibility is a strength, but the current goal seems to be to keep him at shortstop. If he stays the course, the offensive upside he brings to a premium defensive position could be too good to pass up. Ramírez debuted in 2013, at age 20, and by the time he was 24, he signed his first five-year deal for just $26 million. His style of play and versatile profile have allowed him to maintain a consistent level of production over his 13-year career, and he hasn’t shown any signs of slowing down yet. As things stand, Made is the closest comparison to him within the Brewers system. Like Ramírez, Made is toolsy and already off to a hot start as a baseball professional. Like Ramírez, Made won’t get a lifetime extension off the bat; he'd have to earn it and decide to embrace the community multiple times. For a team with Milwaukee’s spending habits, getting a true franchise player is something most fans can only dream of. Christian Yelich is the closest thing the organization currently has, and he spent several of his best years in Miami. Even once you find that guy, when you play in the league's smallest media market, he has to want to be around for the long haul. Ramírez only got $50,000 when he first signed out of the Dominican Republic, so locking him up on that first contract was easy. With each of the last two, though, Cleveland has gotten very lucky—and has been rewarded for very good relationship-building. Ramírez loves the organization and the city, and he's agreed to deals he knew were less lucrative than ones he could have found elsewhere. If a player is ever going to have a Ramírez-like Brewers tenure spanning their entire career, it will have to be because they, too, have fallen so in love with the team, the city and the fans that they would eschew tens of millions to stay. That could be Chourio, Turang, Made or Peña, but the truth is that it's unlikely to happen at all—even in a city so significantly similar to the one where it's happening now.- 5 comments
-
- 3
-

-
- jackson chourio
- brice turang
- (and 3 more)
-
personally i believe in mr. mitchell also joey wiemer mentioned

-
With a little over a month left before the start of the tournament, the rosters for each participating nation are all but finalized. Some countries have a few spots to fill, and Joey Ortiz was recently announced as part of the newest crop of baseball talent to join the Mexican National Team. He was added alongside Jonathan Aranda, Alek Thomas, and Taijuan Walker. Ortiz has Mexican heritage through his parents and should be a big upgrade over Alan Trejo, who served as the team's starting shortstop in 2023. His offensive regression for the Brewers last season was a point of concern, but his defensive production allowed him to stay slightly above replacement, giving him 1.4 fWAR. He'll be joined in the infield by Ramón and Luis Urías, the latter of whom is a former Brewer. Mexico's roster is now stacked with big-leaguers, including many returning faces from 2023 like Randy Arozarena and Jarren Duran. The schedule of the tournament will directly conflict with Spring Training, a crucial time for young talent like Ortiz to prepare for the upcoming season. These refusals are often due to injury risk ,but front offices have occasionally been strict with the way that their younger players are managed. Despite his regression in 2025, it's an encouraging vote of confidence by the franchise that he'll be allowed to forego spring training for the WBC. Ortiz will join fellow Brewers Brice Turang, Jackson Chourio, and Tyler Black in Miami for the competition. View full rumor
-
 With a little over a month left before the start of the tournament, the rosters for each participating nation are all but finalized. Some countries have a few spots to fill, and Joey Ortiz was recently announced as part of the newest crop of baseball talent to join the Mexican National Team. He was added alongside Jonathan Aranda, Alek Thomas, and Taijuan Walker. Ortiz has Mexican heritage through his parents and should be a big upgrade over Alan Trejo, who served as the team's starting shortstop in 2023. His offensive regression for the Brewers last season was a point of concern, but his defensive production allowed him to stay slightly above replacement, giving him 1.4 fWAR. He'll be joined in the infield by Ramón and Luis Urías, the latter of whom is a former Brewer. Mexico's roster is now stacked with big-leaguers, including many returning faces from 2023 like Randy Arozarena and Jarren Duran. The schedule of the tournament will directly conflict with Spring Training, a crucial time for young talent like Ortiz to prepare for the upcoming season. These refusals are often due to injury risk ,but front offices have occasionally been strict with the way that their younger players are managed. Despite his regression in 2025, it's an encouraging vote of confidence by the franchise that he'll be allowed to forego spring training for the WBC. Ortiz will join fellow Brewers Brice Turang, Jackson Chourio, and Tyler Black in Miami for the competition.
 -
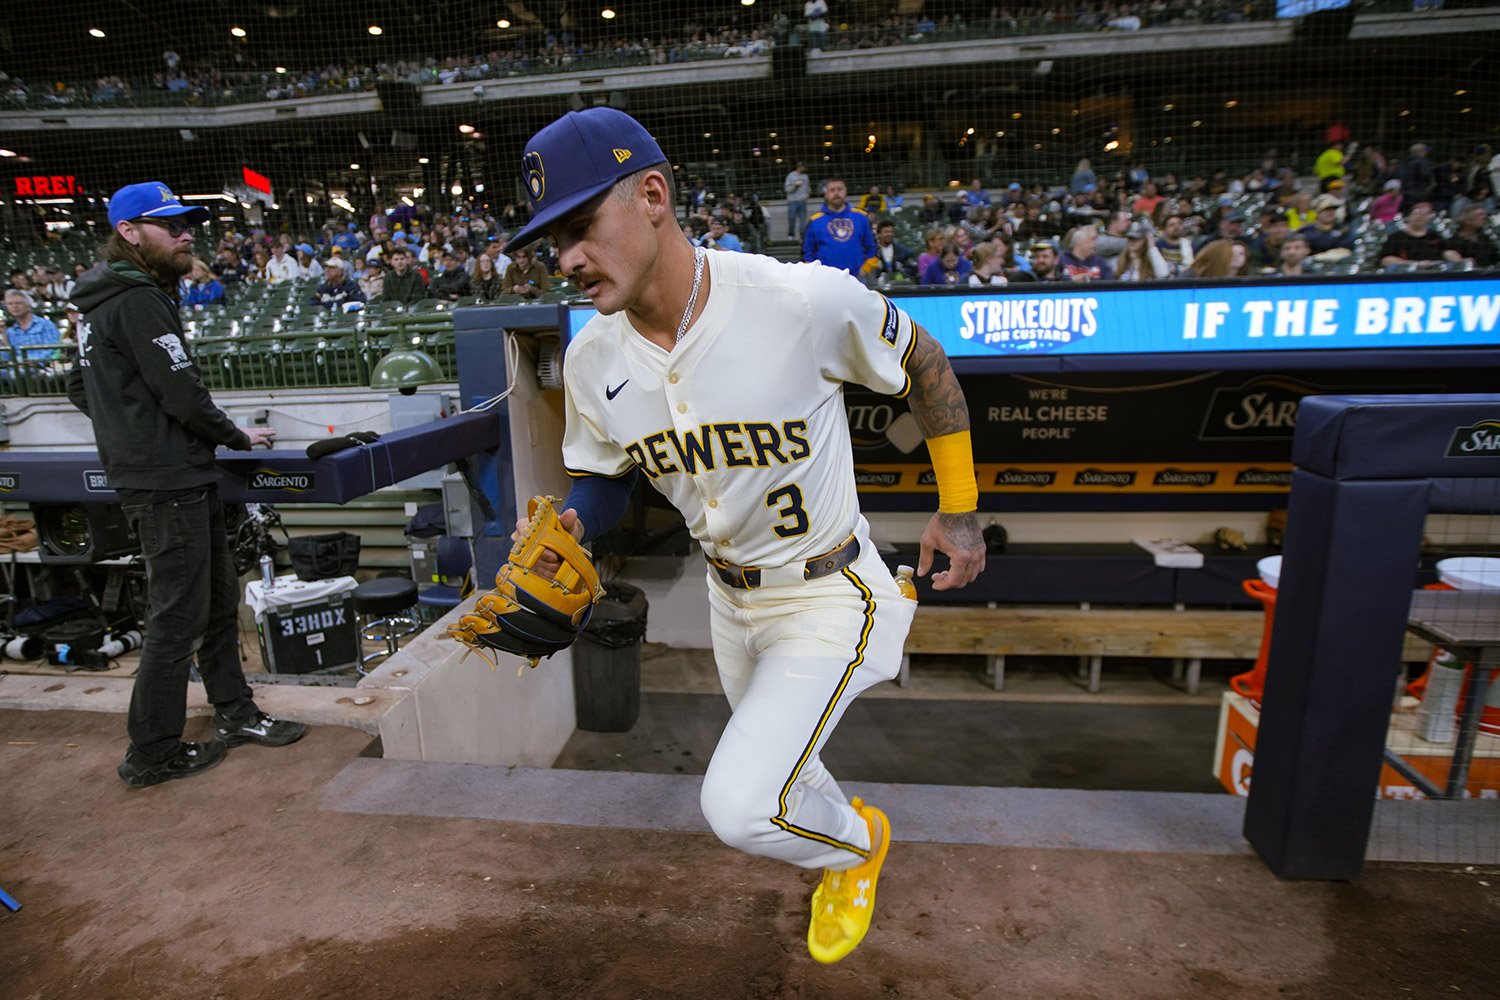
Andrew Fischer Ranked As No. 1 Third Base Prospect
Jason Wang replied to Jason Wang's topic in Brewers Minor League Talk
There's something in the water. There are quiet a few shortstop prospects in the MLB Top 100 and I have a feeling the Brewers will be just one of several teams around the league getting some outstanding players to fill that role. -
MLB Pipeline recently rolled out its list of top prospects at each position, and the Brewers' only representative wasn't Jesús Made or Luis Peña but rather Andrew Fischer. Fischer was drafted 20th overall in 2025 out of the University of Tennessee, where he had an outstanding collegiate career with a blue-chip program. As a Volunteer, he slashed .307/.438/.672 with 56 home runs over three seasons and carried over this success into the 19 professional games he played. Across 87 plate appearances with High-A Wisconsin, he posted a 141 wRC+ and seems poised to continue rocketing up through the minor league ranks. Scouts love the power he generates from the left side, but have questions about his defensive viability. He spent the majority of his final college season playing first base because of his limited agility and range, but the Brewers moved him back to the hot corner after being drafted. This could be a win-win situation. The organization will likely continue assessing his ability to fill the role, and if not, they could move him to first base, where the team arguably has a greater need. While the likes of Joey Ortiz and Caleb Durbin have several years of club control left, Andrew Vaughn will be a free agent in 2028. Milwaukee does have another top corner infield prospect in Luke Adams, but more future depth at the position is certainly welcome. View full rumor
-
 MLB Pipeline recently rolled out its list of top prospects at each position, and the Brewers' only representative wasn't Jesús Made or Luis Peña but rather Andrew Fischer. Fischer was drafted 20th overall in 2025 out of the University of Tennessee, where he had an outstanding collegiate career with a blue-chip program. As a Volunteer, he slashed .307/.438/.672 with 56 home runs over three seasons and carried over this success into the 19 professional games he played. Across 87 plate appearances with High-A Wisconsin, he posted a 141 wRC+ and seems poised to continue rocketing up through the minor league ranks. Scouts love the power he generates from the left side, but have questions about his defensive viability. He spent the majority of his final college season playing first base because of his limited agility and range, but the Brewers moved him back to the hot corner after being drafted. This could be a win-win situation. The organization will likely continue assessing his ability to fill the role, and if not, they could move him to first base, where the team arguably has a greater need. While the likes of Joey Ortiz and Caleb Durbin have several years of club control left, Andrew Vaughn will be a free agent in 2028. Milwaukee does have another top corner infield prospect in Luke Adams, but more future depth at the position is certainly welcome.
 -
matt trueblood is Jake bauers truther what a year to be alive! Neither option is obviously appealing but based on what you and Jake have laid out I'm curious to see how this split will shake out in 2026. I'm pretty bullish but the ceiling is what I'm most intrigued about.
-
Image courtesy of © Michael McLoone-Imagn Images / © Denis Poroy-Imagn Images In case you missed it, the Cubs made a move to acquire right-handed starter Edward Cabrera from the Marlins. In exchange, they sent over three prospects: Owen Caissie (No. 47 prospect overall), middle infielder Cristian Hernandez (No.11 CHC prospect), and corner infielder Edgardo De Leon. It’s a big move for the Cubs’ rotation for several reasons, but here at Brewer Fanatic, we only care about how it affects us on the north side of I-94. We’ve already established that Milwaukee’s front office doesn’t let the moves of even its closest rivals drive the pace at which they operate their offseason, but that doesn’t mean they haven’t been paying attention. They weren’t looking to acquire Cabrera, nor did they care about any of Chicago’s prospects sent to Miami,but his price could dictate what other teams may be willing to pay for Freddy Peralta. Let’s start by getting a high-level overview of how these two starting pitchers stack up against each other in 2025: Freddy Peralta Edward Cabrera IP 176.2 137.2 ERA 2.70 3.53 ERA- 65 83 FIP 3.64 3.83 FIP- 88 93 fWAR 3.6 2.0 K% 28.2% 25.8% BB% 9.1% 8.3% On paper, it seems like Freddy was clearly the better pitcher. He had better results in every major statistical category other than walk rate over a larger sample size. If you want to get into the weeds about what Cabrera did better, you can point out his slightly higher chase rate or his greater run value efficiency with breaking pitches, but ultimately, he didn’t do as much for the Marlins as Peralta did for the Brewers. However, performance over a single season or even over several past seasons is far from the only thing that front offices look at when assessing trades. Another important factor is the player's future value. Team control and future upside are both key decision-making components as well. 2026 will be Peralta’s final season under team control, which is exactly the reason Milwaukee is tempted to trade him. Making a competitive offer to retain him in free agency simply doesn’t fit with their organization’s modus operandi, and like Devin Williams, Corbin Burnes, and Josh Hader, selling high on pitching talent is more their speed. For the acquiring team, the incentive to acquire him would be to serve as a one-year boon to a rotation that’s ambitious about making the playoffs but may not have the pieces to do so right now. This could be because of waiting on younger talent to debut and/or develop, injuries, or a mix of several factors. The Cubs’ acquisition of Kyle Tucker last offseason fell into this camp, giving them a much-needed boost to make the postseason for the first time since 2020. Of course, this comes under the assumption that the player will be as productive as usual in that one year and not face injuries or steep regression over a short-lived tenure. On the other hand, Cabrera is much more of a long-term investment. He won’t hit free agency until 2029, and up to that point, he’ll come at an affordable price. He made just $1.95 million in 2025 and agreed to a $4.45 million contract with the Cubs shortly after being traded. Cabrera is also younger by almost two years and, according to our good friends at North Side Baseball, has a lot of potential just waiting to be unlocked by Chicago’s pitching development staff. Before we assess how Peralta’s market value compares to that of Cabrera’s, it’s also important to touch on the state of other starting pitching offerings, specifically free agents. It’s a fairly skewed set of offerings this winter with Framber Valdez and Ranger Suarez likely exceeding the financial restrictions of most MLB organizations while also being significantly more enticing than the rest of the offerings. This makes someone like Peralta, who is great but not quite elite, an appealing middle-of-the-road option, especially given his team-friendly $8 million salary for this upcoming season. In turn, this gives the Brewers’ negotiating leverage as they have no obligation to let him go but would be more than willing to move him for the right price. In exchange for a player with two more years of team control, respectable promise, and recent numbers that are a step below what Peralta posted in 2025, the Marlins were able to get three prospects, including one that was in the MLB Top 100. Should Peralta expect to get something similar? To me, the answer is complex. Because of his cheap contract, it’s not the end of the world if Milwaukee doesn’t get anything out of him by way of prospects this year. In fact, earlier in the offseason, Matt Arnold said it wasn’t something he was thinking about, but that could be yet another front office psyop. But if it is true, it leads to a situation where he’d only be traded if the return was significant. A recent move that serves as an apt comparison is the deal that sent Burnes to Baltimore. Similarly, he had a single year of team control remaining, and Milwaukee turned him into Joey Ortiz (No. 99 overall prospect in 2023), DL Hall (No. 97 overall prospect in 2023), and a compensatory draft pick. A fairly good haul, especially considering that draft pick was used to select Blake Burke in 2024. There was more urgency to trade Burnes, but he was also considered more of an ace that could be slotted at the top of nearly any rotation in MLB at the time, which leads me to believe Peralta could absolutely net a similar prospect package. With all of this in mind, it wouldn’t be out of the ordinary to see Peralta bring Milwaukee a compelling set of prospects. He has a more established body of work and, along with his contributions on the mound, can also bring leadership and other veteran qualities to any clubhouse. The Brewers won’t let him go for just anyone, but the Edward Cabrera trade established a baseline of what teams should expect to pay if they want him for 2026. View full article
-
What The Edward Cabrera Trade Means For Freddy Peralta’s Market
Jason Wang posted an article in Brewers
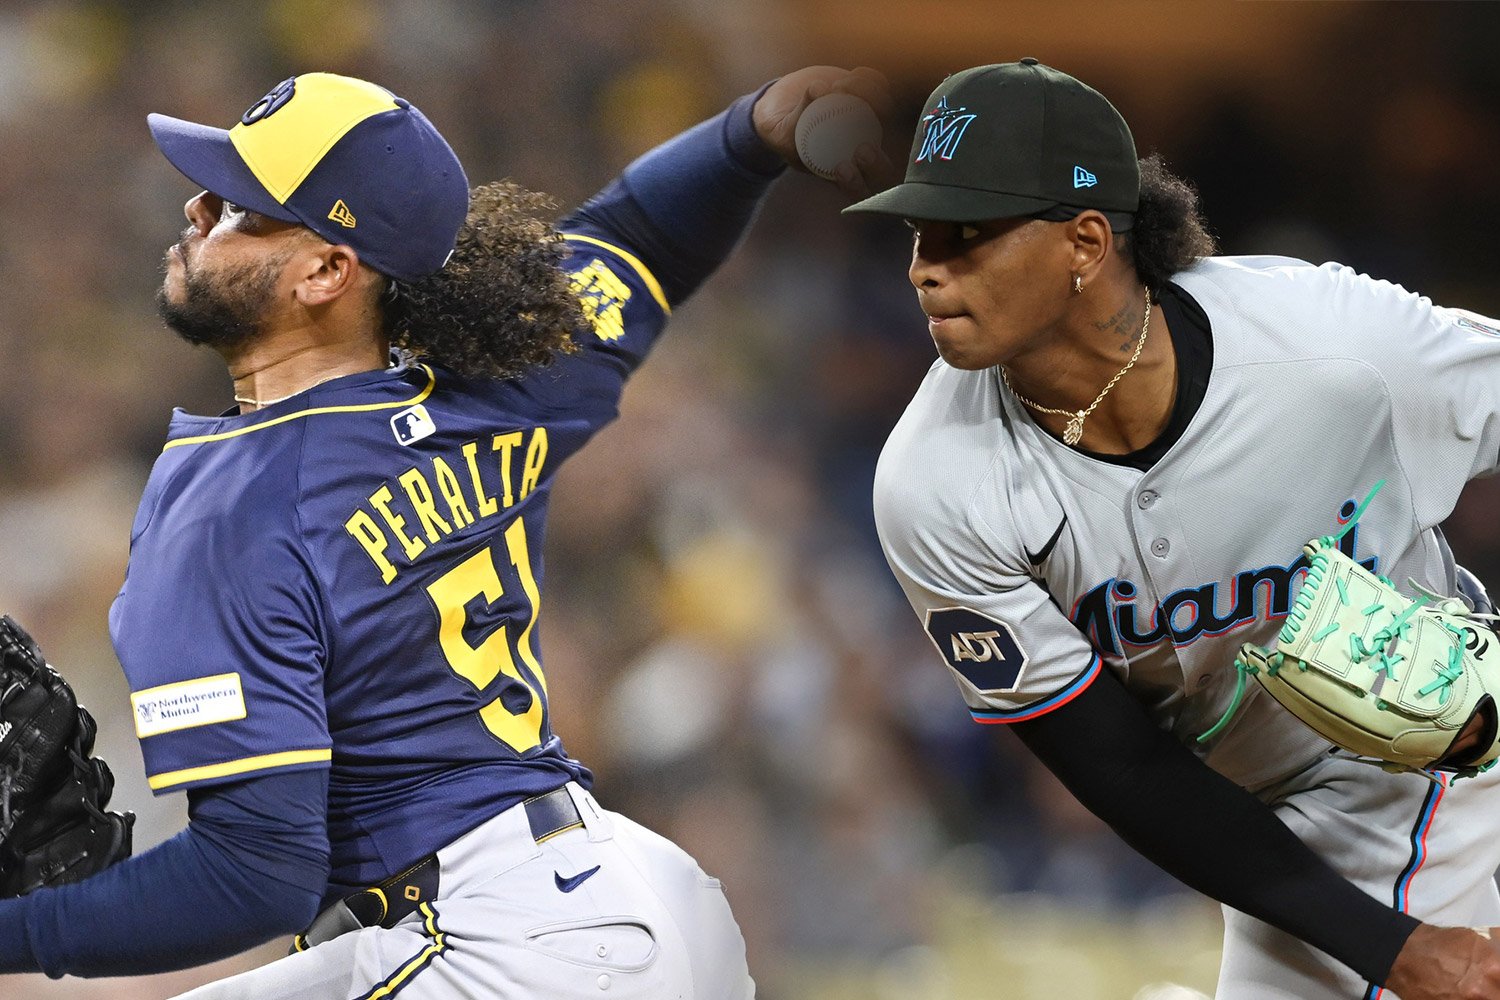 In case you missed it, the Cubs made a move to acquire right-handed starter Edward Cabrera from the Marlins. In exchange, they sent over three prospects: Owen Caissie (No. 47 prospect overall), middle infielder Cristian Hernandez (No.11 CHC prospect), and corner infielder Edgardo De Leon. It’s a big move for the Cubs’ rotation for several reasons, but here at Brewer Fanatic, we only care about how it affects us on the north side of I-94. We’ve already established that Milwaukee’s front office doesn’t let the moves of even its closest rivals drive the pace at which they operate their offseason, but that doesn’t mean they haven’t been paying attention. They weren’t looking to acquire Cabrera, nor did they care about any of Chicago’s prospects sent to Miami,but his price could dictate what other teams may be willing to pay for Freddy Peralta. Let’s start by getting a high-level overview of how these two starting pitchers stack up against each other in 2025: Freddy Peralta Edward Cabrera IP 176.2 137.2 ERA 2.70 3.53 ERA- 65 83 FIP 3.64 3.83 FIP- 88 93 fWAR 3.6 2.0 K% 28.2% 25.8% BB% 9.1% 8.3% On paper, it seems like Freddy was clearly the better pitcher. He had better results in every major statistical category other than walk rate over a larger sample size. If you want to get into the weeds about what Cabrera did better, you can point out his slightly higher chase rate or his greater run value efficiency with breaking pitches, but ultimately, he didn’t do as much for the Marlins as Peralta did for the Brewers. However, performance over a single season or even over several past seasons is far from the only thing that front offices look at when assessing trades. Another important factor is the player's future value. Team control and future upside are both key decision-making components as well. 2026 will be Peralta’s final season under team control, which is exactly the reason Milwaukee is tempted to trade him. Making a competitive offer to retain him in free agency simply doesn’t fit with their organization’s modus operandi, and like Devin Williams, Corbin Burnes, and Josh Hader, selling high on pitching talent is more their speed. For the acquiring team, the incentive to acquire him would be to serve as a one-year boon to a rotation that’s ambitious about making the playoffs but may not have the pieces to do so right now. This could be because of waiting on younger talent to debut and/or develop, injuries, or a mix of several factors. The Cubs’ acquisition of Kyle Tucker last offseason fell into this camp, giving them a much-needed boost to make the postseason for the first time since 2020. Of course, this comes under the assumption that the player will be as productive as usual in that one year and not face injuries or steep regression over a short-lived tenure. On the other hand, Cabrera is much more of a long-term investment. He won’t hit free agency until 2029, and up to that point, he’ll come at an affordable price. He made just $1.95 million in 2025 and agreed to a $4.45 million contract with the Cubs shortly after being traded. Cabrera is also younger by almost two years and, according to our good friends at North Side Baseball, has a lot of potential just waiting to be unlocked by Chicago’s pitching development staff. Before we assess how Peralta’s market value compares to that of Cabrera’s, it’s also important to touch on the state of other starting pitching offerings, specifically free agents. It’s a fairly skewed set of offerings this winter with Framber Valdez and Ranger Suarez likely exceeding the financial restrictions of most MLB organizations while also being significantly more enticing than the rest of the offerings. This makes someone like Peralta, who is great but not quite elite, an appealing middle-of-the-road option, especially given his team-friendly $8 million salary for this upcoming season. In turn, this gives the Brewers’ negotiating leverage as they have no obligation to let him go but would be more than willing to move him for the right price. In exchange for a player with two more years of team control, respectable promise, and recent numbers that are a step below what Peralta posted in 2025, the Marlins were able to get three prospects, including one that was in the MLB Top 100. Should Peralta expect to get something similar? To me, the answer is complex. Because of his cheap contract, it’s not the end of the world if Milwaukee doesn’t get anything out of him by way of prospects this year. In fact, earlier in the offseason, Matt Arnold said it wasn’t something he was thinking about, but that could be yet another front office psyop. But if it is true, it leads to a situation where he’d only be traded if the return was significant. A recent move that serves as an apt comparison is the deal that sent Burnes to Baltimore. Similarly, he had a single year of team control remaining, and Milwaukee turned him into Joey Ortiz (No. 99 overall prospect in 2023), DL Hall (No. 97 overall prospect in 2023), and a compensatory draft pick. A fairly good haul, especially considering that draft pick was used to select Blake Burke in 2024. There was more urgency to trade Burnes, but he was also considered more of an ace that could be slotted at the top of nearly any rotation in MLB at the time, which leads me to believe Peralta could absolutely net a similar prospect package. With all of this in mind, it wouldn’t be out of the ordinary to see Peralta bring Milwaukee a compelling set of prospects. He has a more established body of work and, along with his contributions on the mound, can also bring leadership and other veteran qualities to any clubhouse. The Brewers won’t let him go for just anyone, but the Edward Cabrera trade established a baseline of what teams should expect to pay if they want him for 2026.
 -
In all seriousness, I think that's the next big step for MLB in terms of democratizing data is giving us more of a glimpse into the minors. I know they're gradually rolling Statcast out to big league stadiums but these front offices have to be getting them somehow and I'm determined to figure out how to get my grubby mitts on it.
-
the response i get when I ask people where they get minor league batted ball data
-
Is there a place that people are getting granular bat speed/launch angle information for the lower levels of the minor leagues? I wanna take a closer look at Kay-Lan Nicasia
-
we get it jake ur from europe
-
I think in the example you provided above, players are rewarded/penalized for their responsible part of the play. So if the second baseman makes a weak throw or first baseman fails to pick a routine ball, they'd have their DRS scores decreased by the value of the play. Sample size plays into each by serving as the final comparison to determine how many defensive runs above or below average a given player is. It's also a counting stat because each play is worth a fixed number of runs so early on in the season, an elite defender may only have +3 DRS but as the season stretches on, he'll continue to accumulate more. If that same defender only plays 40 games, he may still only have +3 DRS although over a full 162 he may have closer to 12. Denzel Clarke is an excellent example of this. He only played 47 games in the majors last year but did enough to accumulate 7 DRS, placing him 12th in MLB despite being more than 600 innings short of qualified.
-
Image courtesy of © Michael McLoone-Imagn Images Heading into last year’s trade deadline, I wrote an article about the areas in which I thought the Brewers needed to upgrade. One of the things I pointed out was that at the time, Milwaukee ranked near the bottom of MLB for OPS and Defensive Runs Saved from shortstop. I went on to write that based on this figure, Joey Ortiz’s defensive abilities had slipped, a statement which was met with quite a bit of pushback from commenters. One reader pointed out that -7 DRS didn’t match the eye test, and others generally agreed that the figure didn’t seem to be an accurate representation. In an effort to save what little journalistic reputation I currently have, I tried my best to explain what was going on, but to be honest, I was starting to get as confused as everyone else. His numbers at the end of the season only made things worse. After playing 1,217 ⅔ innings at shortstop in 2025, Ortiz ended with 12 Outs Above Average (5th among shortstops) and -2 Defensive Runs Saved (14th among qualified shortstops). So how is it that these numbers, which should theoretically give us a quick idea of whether someone is a good, great, or bad defender, are telling two different stories? Interestingly enough, he wasn’t even the only Brewer for whom this was true. I wrote another article about Brice Turang’s diverging defensive narratives in August. So, since I wasn’t the only one who was confused by exactly what these numbers meant and how to interpret them, I figured a deeper dive into each was necessary. Defensive Runs Saved (DRS) In the beginning, the main way to assess a player’s defensive abilities was fielding percentage. It was a simple formula (putouts divided by total chances), but it was far too basic to capture any of the nuance of fielding. A great example is Nick Castellanos, who had a perfect 1.000 fielding percentage in 2022, 2023, and 2025 as a starting outfielder, but is also a notoriously bad defender. The DRS framework was first introduced in 2009 by John Dewan and Bill James, who had used data from Sports Info Solutions dating back to 2003 to consider more variables in the field. In their modern forms, these are: ART (Airballs, Range, and Throwing) Runs Saved (All Fielders) Good Plays/Defensive Misplays and Errors Runs Saved (All Fielders) Bunt Runs Saved (Corner Infielders, Catchers, Pitchers) Double Play Runs Saved (Middle Infielders and Corner Infielders) Outfielder Arm Runs Saved (Outfielders) Pitcher Stolen Base Runs Saved (Pitchers) Catcher Stolen Base Runs Saved (Catchers) Strike Zone Runs Saved (Catchers) Catcher Adjusted Earned Runs Saved (Catchers) To calculate all of this, each component of a play is assigned a bucket and a difficulty value. The bucket depends on which aspect of defense is being tested. For example, a right fielder throwing out a runner going first to third would receive credit to this rARM, while a smooth double play by two middle infielders would go into their rGDP buckets. This value is based on the percentage of similar balls in play that were successfully converted to outs. So, if the throw from the right fielder to third base was made into an out in 99% of similar situations (unlikely, but go with me), it would get an expected value of 0.99, while a tough diving stop to start a double play that was made by 1% of shortstops would have a value of 0.01. If the play is successfully made, the player receives (1 - expected value) to the respective bucket. If they botch it, they lose that much value. So a successful routine grounder with an expected success rate of 85% would net a fielder 0.15 plays above average, but flubbing it would leave them with a -0.85. The value of each bucket then gets converted to a run total, based on context and a run expectancy matrix. The final DRS for a given player is the difference between the total value of their plays made and missed in all buckets relevant to their positions and the league average. Most are pretty straightforward, but I wanted to highlight two that sound pretty darn similar: rGFP and rPM. rPM stands for Runs from Plus-Minus, which primarily tracks range and assigns a value to each batted ball based on characteristics like location and historical success rates. rGFP is used in special circumstances where a defensive action contributes or costs value based on playmaking or intellect, rather than sheer ball-chasing. Examples include a first baseman scooping a bad throw or a batter being held to a single instead of a double because of an outfielder’s actions. This also counts against the player for doing things like missing the cutoff man or messing up a double play to get one out instead of two. The numbers are broken down by category on the Fielding Bible website, so (for instance) we can see that Ortiz was much better moving to his left than to his right; got value from his strong arm but struggled on turning double plays; and came out essentially even in defensive misplays and good plays, though that doesn't mean that he made the same number of them. He just had a roughly average ratio between them for a shortstop. We don’t get to see which plays moved the needle the most, though, so a negative DRS may mean that they’re average but regularly struggle with more difficult plays, or it could mean they’re messing up routine plays. Like WAR, DRS attempts to factor in every detailed aspect of fielding a baseball and arrive at a somewhat definitive number, but we tend to get summary judgments from it, rather than play-by-play breakdowns. For more information, feel free to check Fielding Bible’s FAQ on DRS. Outs Above Average (OAA) Outs Above Average was one of Statcast’s ways of gauging a player’s defense. It came out shortly after the system was introduced league-wide in 2015. Like DRS, it’s calculated slightly differently depending on which position you’re assessing. In the outfield, each ball in play is assigned a catch probability value based on the distance an outfielder has to cover, the direction he must travel, and the time he has to get to his destination. Like DRS, the fielder receives credit for each play made equal to (1 - catch probability) and loses value equivalent to the catch probability for failing to make the play. The infield is similar, but uses a more complex formula to handle the additional defensive intricacies. It considers distance covered and time, but it also accounts for the distance from the fielder at the “intercept point” (position after getting to the ball) to the base the runner is heading for. On force plays, it also factors in the sprint speed of the hitter. The biggest difference between OAA and DRS is that the former almost solely measures range, while the latter uses range as one of several ingredients in the recipe. This allows OAA to be calculated without video review, as the calculation is purely number-based. Furthermore, OAA is context-neutral, as it’s purely outs, not runs. This means a play made with the bases empty and one with the bases loaded counts the same. This partially explains why some players have such a disparity between their OAA and DRS figures. One good example is Bobby Witt Jr., who had 24 OAA and just 3 DRS in 2025, a disparity of 21. He and Zach Neto were the only two players I found to have a disparity this significant between the two metrics last season. Witt had a fairly high number of Defensive Misplays and Errors (33, which was eight more than Ortiz), but rated very well with his arm and was great going to his right, which made up for some weaknesses on balls up the middle. That pattern (good arm, better right than left, a few more mistakes than would be ideal) maps neatly to DRS; OAA just viewed him as making more plays above average than DRS's system estimated. Given what we now know about DRS and OAA, we could state that a play that would negatively impact DRS more than OAA could look something like: A mistake made in a higher run expectancy situation (e.g., runners in scoring position) A fair hit that was fielded in a way that allowed a runner to advance further than he should’ve A double play that resulted in just one out Based on this criteria, one example could be this play against the Athletics, where a soft flip to second baseman Jonathan India recorded an out but a better throw could’ve allowed the Royals to pick up an additional out. This play may fall into the higher run expectancy situation category, because a late spinning throw by Witt results in a run scored (and a game lost). Ah, but one other issue is that OAA and DRS are not calculated on the same scale. You can hear it in their names, right? One is runs saved; the other is outs added, or hits saved. For instance, Witt's 3 DRS came on 6 Plays Saved; there's a remaining conversion to be made. Each play made saves part of a hit, and thereby saves a fraction of a run. The OAA model's cousin makes that conversion from outs added to runs saved, to put Statcast and Sports Info Solutions's metrics on the same footing. Fielding Run Value (FRV) FRV is Statcast’s answer to DRS. It's largely based on OAA, which is why most players who have high OAA figures will also have high FRV figures, even if they score poorly in DRS. It also bakes in throwing; framing and blocking for catchers; and other subtle skills. FRV converts underlying metrics into runs, but it shouldn’t tell you a story that’s different from OAA. Because many fans don't understand that it's the final form of OAA (and because of its hellaciously awkward name), FRV is cited less often than either of the other two. Whereas OAA is easy to find (it shows up on every player’s Savant summary), and whereas DRS is the original advanced defensive metric, it's hard to immediately grasp the utility of FRV. Nonetheless, to properly compare two players, look either at their PART Plays Saved (on the Fielding Bible site) and their OAA, or at their DRS and their FRV. Offensive metrics have always been far easier to assess than defensive ones. Even with a head start, though, there’s disagreement over which metrics truly describe how good a hitter is. Things have now been refined enough where for many, using OPS or wRC+ is usually sufficient to get your point across, but things are not so simple for defensive numbers. OPS+ and wRC+ never diverge significantly, but that’s because they more or less measure the same thing and are made up of very similar inputs. On the other hand, DRS and OAA/FRV do some things materially differently. Subjectively, DRS makes the most sense to me as a solid measure of cumulative defensive production. That doesn’t mean that OAA and FRV are wrong; they just make some different assumptions and incorporate human help to a lesser degree. There’s only so much we can unpack without getting access to more granular data on individual plays, but at the very least, we can now translate numbers to meaning. Choose your fighter according to your new, improved understanding about these numbers and what forms them. View full article
-
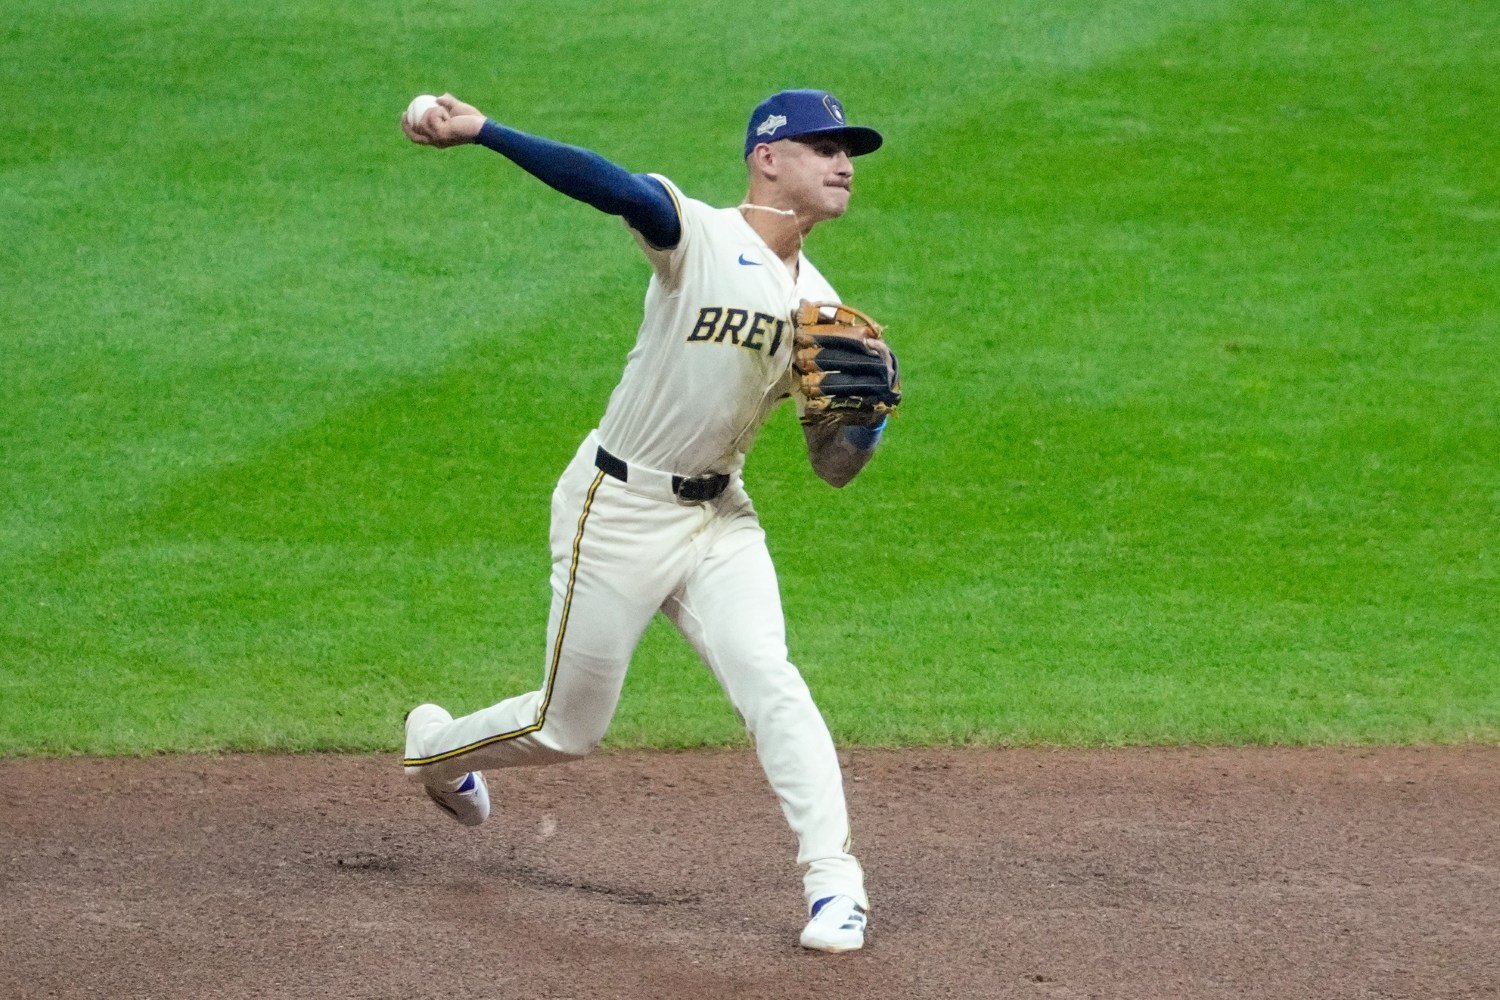 Heading into last year’s trade deadline, I wrote an article about the areas in which I thought the Brewers needed to upgrade. One of the things I pointed out was that at the time, Milwaukee ranked near the bottom of MLB for OPS and Defensive Runs Saved from shortstop. I went on to write that based on this figure, Joey Ortiz’s defensive abilities had slipped, a statement which was met with quite a bit of pushback from commenters. One reader pointed out that -7 DRS didn’t match the eye test, and others generally agreed that the figure didn’t seem to be an accurate representation. In an effort to save what little journalistic reputation I currently have, I tried my best to explain what was going on, but to be honest, I was starting to get as confused as everyone else. His numbers at the end of the season only made things worse. After playing 1,217 ⅔ innings at shortstop in 2025, Ortiz ended with 12 Outs Above Average (5th among shortstops) and -2 Defensive Runs Saved (14th among qualified shortstops). So how is it that these numbers, which should theoretically give us a quick idea of whether someone is a good, great, or bad defender, are telling two different stories? Interestingly enough, he wasn’t even the only Brewer for whom this was true. I wrote another article about Brice Turang’s diverging defensive narratives in August. So, since I wasn’t the only one who was confused by exactly what these numbers meant and how to interpret them, I figured a deeper dive into each was necessary. Defensive Runs Saved (DRS) In the beginning, the main way to assess a player’s defensive abilities was fielding percentage. It was a simple formula (putouts divided by total chances), but it was far too basic to capture any of the nuance of fielding. A great example is Nick Castellanos, who had a perfect 1.000 fielding percentage in 2022, 2023, and 2025 as a starting outfielder, but is also a notoriously bad defender. The DRS framework was first introduced in 2009 by John Dewan and Bill James, who had used data from Sports Info Solutions dating back to 2003 to consider more variables in the field. In their modern forms, these are: ART (Airballs, Range, and Throwing) Runs Saved (All Fielders) Good Plays/Defensive Misplays and Errors Runs Saved (All Fielders) Bunt Runs Saved (Corner Infielders, Catchers, Pitchers) Double Play Runs Saved (Middle Infielders and Corner Infielders) Outfielder Arm Runs Saved (Outfielders) Pitcher Stolen Base Runs Saved (Pitchers) Catcher Stolen Base Runs Saved (Catchers) Strike Zone Runs Saved (Catchers) Catcher Adjusted Earned Runs Saved (Catchers) To calculate all of this, each component of a play is assigned a bucket and a difficulty value. The bucket depends on which aspect of defense is being tested. For example, a right fielder throwing out a runner going first to third would receive credit to this rARM, while a smooth double play by two middle infielders would go into their rGDP buckets. This value is based on the percentage of similar balls in play that were successfully converted to outs. So, if the throw from the right fielder to third base was made into an out in 99% of similar situations (unlikely, but go with me), it would get an expected value of 0.99, while a tough diving stop to start a double play that was made by 1% of shortstops would have a value of 0.01. If the play is successfully made, the player receives (1 - expected value) to the respective bucket. If they botch it, they lose that much value. So a successful routine grounder with an expected success rate of 85% would net a fielder 0.15 plays above average, but flubbing it would leave them with a -0.85. The value of each bucket then gets converted to a run total, based on context and a run expectancy matrix. The final DRS for a given player is the difference between the total value of their plays made and missed in all buckets relevant to their positions and the league average. Most are pretty straightforward, but I wanted to highlight two that sound pretty darn similar: rGFP and rPM. rPM stands for Runs from Plus-Minus, which primarily tracks range and assigns a value to each batted ball based on characteristics like location and historical success rates. rGFP is used in special circumstances where a defensive action contributes or costs value based on playmaking or intellect, rather than sheer ball-chasing. Examples include a first baseman scooping a bad throw or a batter being held to a single instead of a double because of an outfielder’s actions. This also counts against the player for doing things like missing the cutoff man or messing up a double play to get one out instead of two. The numbers are broken down by category on the Fielding Bible website, so (for instance) we can see that Ortiz was much better moving to his left than to his right; got value from his strong arm but struggled on turning double plays; and came out essentially even in defensive misplays and good plays, though that doesn't mean that he made the same number of them. He just had a roughly average ratio between them for a shortstop. We don’t get to see which plays moved the needle the most, though, so a negative DRS may mean that they’re average but regularly struggle with more difficult plays, or it could mean they’re messing up routine plays. Like WAR, DRS attempts to factor in every detailed aspect of fielding a baseball and arrive at a somewhat definitive number, but we tend to get summary judgments from it, rather than play-by-play breakdowns. For more information, feel free to check Fielding Bible’s FAQ on DRS. Outs Above Average (OAA) Outs Above Average was one of Statcast’s ways of gauging a player’s defense. It came out shortly after the system was introduced league-wide in 2015. Like DRS, it’s calculated slightly differently depending on which position you’re assessing. In the outfield, each ball in play is assigned a catch probability value based on the distance an outfielder has to cover, the direction he must travel, and the time he has to get to his destination. Like DRS, the fielder receives credit for each play made equal to (1 - catch probability) and loses value equivalent to the catch probability for failing to make the play. The infield is similar, but uses a more complex formula to handle the additional defensive intricacies. It considers distance covered and time, but it also accounts for the distance from the fielder at the “intercept point” (position after getting to the ball) to the base the runner is heading for. On force plays, it also factors in the sprint speed of the hitter. The biggest difference between OAA and DRS is that the former almost solely measures range, while the latter uses range as one of several ingredients in the recipe. This allows OAA to be calculated without video review, as the calculation is purely number-based. Furthermore, OAA is context-neutral, as it’s purely outs, not runs. This means a play made with the bases empty and one with the bases loaded counts the same. This partially explains why some players have such a disparity between their OAA and DRS figures. One good example is Bobby Witt Jr., who had 24 OAA and just 3 DRS in 2025, a disparity of 21. He and Zach Neto were the only two players I found to have a disparity this significant between the two metrics last season. Witt had a fairly high number of Defensive Misplays and Errors (33, which was eight more than Ortiz), but rated very well with his arm and was great going to his right, which made up for some weaknesses on balls up the middle. That pattern (good arm, better right than left, a few more mistakes than would be ideal) maps neatly to DRS; OAA just viewed him as making more plays above average than DRS's system estimated. Given what we now know about DRS and OAA, we could state that a play that would negatively impact DRS more than OAA could look something like: A mistake made in a higher run expectancy situation (e.g., runners in scoring position) A fair hit that was fielded in a way that allowed a runner to advance further than he should’ve A double play that resulted in just one out Based on this criteria, one example could be this play against the Athletics, where a soft flip to second baseman Jonathan India recorded an out but a better throw could’ve allowed the Royals to pick up an additional out. This play may fall into the higher run expectancy situation category, because a late spinning throw by Witt results in a run scored (and a game lost). Ah, but one other issue is that OAA and DRS are not calculated on the same scale. You can hear it in their names, right? One is runs saved; the other is outs added, or hits saved. For instance, Witt's 3 DRS came on 6 Plays Saved; there's a remaining conversion to be made. Each play made saves part of a hit, and thereby saves a fraction of a run. The OAA model's cousin makes that conversion from outs added to runs saved, to put Statcast and Sports Info Solutions's metrics on the same footing. Fielding Run Value (FRV) FRV is Statcast’s answer to DRS. It's largely based on OAA, which is why most players who have high OAA figures will also have high FRV figures, even if they score poorly in DRS. It also bakes in throwing; framing and blocking for catchers; and other subtle skills. FRV converts underlying metrics into runs, but it shouldn’t tell you a story that’s different from OAA. Because many fans don't understand that it's the final form of OAA (and because of its hellaciously awkward name), FRV is cited less often than either of the other two. Whereas OAA is easy to find (it shows up on every player’s Savant summary), and whereas DRS is the original advanced defensive metric, it's hard to immediately grasp the utility of FRV. Nonetheless, to properly compare two players, look either at their PART Plays Saved (on the Fielding Bible site) and their OAA, or at their DRS and their FRV. Offensive metrics have always been far easier to assess than defensive ones. Even with a head start, though, there’s disagreement over which metrics truly describe how good a hitter is. Things have now been refined enough where for many, using OPS or wRC+ is usually sufficient to get your point across, but things are not so simple for defensive numbers. OPS+ and wRC+ never diverge significantly, but that’s because they more or less measure the same thing and are made up of very similar inputs. On the other hand, DRS and OAA/FRV do some things materially differently. Subjectively, DRS makes the most sense to me as a solid measure of cumulative defensive production. That doesn’t mean that OAA and FRV are wrong; they just make some different assumptions and incorporate human help to a lesser degree. There’s only so much we can unpack without getting access to more granular data on individual plays, but at the very least, we can now translate numbers to meaning. Choose your fighter according to your new, improved understanding about these numbers and what forms them.
 -
 In just over five weeks, pitchers and catchers will report, signaling the start of spring training. By then, organizations will begin to finalize their Opening Day rosters, and fans should have a pretty good idea as to how competitive their favorite team will be in the upcoming year. For many teams, the biggest moves have already been made. A flurry of activity happened at or around the Winter Meetings, and organizations have already committed to over $1 billion in free-agent contracts. The Blue Jays have been the most aggressive in locking down talent, notably signing Dylan Cease ($210 million, 7 years), Kazuma Okamoto ($60 million, 4 years), and Cody Ponce ($30 million, 3 years). Most other teams have made at least one big free agent acquisition or trade, but the Brewers have remained comparatively quiet. The only free agent Milwaukee has signed is Akil Baddoo, and the only trade they’ve made thus far sent Isaac Collins and Nick Mears to the Royals in exchange for Angel Zerpa. Neither move is expected to move the needle, which begs the question: What are they waiting for? It’s important to remember that this is how Milwaukee has operated in the offseason for quite some time now. The Brewers have never been huge fans of pursuing big-name free agents, who are often the first to get pulled off the board. They’re quite expensive, and the sheer amount of bidders for any given player often drives prices past the financial comfort zone of the front office. Many of the largest contracts in franchise history were extensions for players like Christian Yelich and Ryan Braun, making Lorenzo Cain’s $80 million contract signed in 2018 the largest free-agent deal Milwaukee has ever inked. Instead of simply throwing money at their problems, the Brewers love to find undervalued assets and bid low on them, relying on their outstanding internal player development and taking low-risk bets on players that others have already glossed over. In order to do this, deals are often struck late when the negotiating leverage shifts away from the player and towards any club willing to give them a chance. A few recent notable examples of late free agent signings include: Jose Quintana: Signed on March 5, 2025 Brandon Woodruff: Signed on February 21, 2024 Rhys Hoskins: Signed on January 26, 2024 Wade Miley: Signed on January 9, 2023 None of these four players was highly sought-after, and each came with an asterisk. For Woodruff and Hoskins, it was injury-related. It was understood that Woodruff would miss the entire 2024 season and part of the 2025 season, while Hoskins had just missed the entire 2023 season after tearing his ACL in spring training. For Miley and Quintana, it was age. Both starting pitchers were 36 years old when they signed their deals and seemed to be in the twilight of their big-league careers. These players were effective but only if you looked past the unappealing circumstances on the surface and were willing to take a chance (Hoskins may be the only exception, but hey, you can’t be right 100% of the time, that’s not fair for the other teams). Another factor that’s likely contributing to the Brewers’ sluggish pace of roster revamping is that their needs don't align well with what they’re willing to pay. There aren’t any major holes in the current roster and, barring a trade of someone like Freddy Peralta, all of the biggest contributors to the team’s success in 2025 will be along for the ride in 2026. However, if there were one aspect that could use some love, it’d be finding power in the lineup. In 2025, they ranked deceptively high in slugging percentage because their .258 batting average placed third in MLB, but they ranked 22nd in home runs (166) and 25th in ISO (.145). If Andrew Vaughn somehow manages to maintain his 141 OPS+ over the course of a full season, it may not be a problem, but precedent would suggest that outcome is unlikely. But these days, power doesn’t come cheap. Kyle Schwarber, an archetypal three-true-outcome player, returned to the Phillies for $150 million over five years. Pete Alonso signed a similar contract with the Orioles for $155 million over five years. There aren’t many slugging free agents left, and those that are available, like Kyle Tucker, are absolutely out of the Brewers’ price range. It’s a similar story with starting pitching. Milwaukee has a considerable number of young arms in the rotation. Still, if they want to pursue a veteran arm to back up Peralta, it would cost a considerable amount, either in cash or prospects. This seems like a big reason why they’ll look to retain Peralta this year, especially since he’ll be paid just $8 million to be the team’s ace. And so, their patience is understandable given their strategy. They’ll continue to wait until the marquee names are snatched up at a premium or full price, paving the way for the not great but still good players to be slowly and surely marked down with each passing week. Even if they don’t do anything, their roster remains solid, and their young core will only continue to improve. The one caveat to all this is that the other teams in the division aren’t quite so passive. The Cardinals have already made a handful of trades (albeit to enter an apparent rebuild), and the Cubs have made quite a few small moves to reinforce their bullpen. The most surprising organization has been the Pirates, who, aside from being interested in players like Schwarber, Josh Naylor, and Okamoto, picked up Ryan O'Hearn and Gregory Soto in free agency before also acquiring Brandon Lowe in a three-team trade. None of these moves is necessarily enough for the Brewers to fear for their position atop the NL Central yet, but at the same time, they can’t be totally ignored. Still, the front office tends to march to the beat of its own drum, regardless of what its closest rivals are up to. Realistically, the organization is likely biding its time and waiting to get what it needs at the right price. It may not happen soon, but something will happen eventually. Probably.
 -
Image courtesy of © Benny Sieu-Imagn Images In just over five weeks, pitchers and catchers will report, signaling the start of spring training. By then, organizations will begin to finalize their Opening Day rosters, and fans should have a pretty good idea as to how competitive their favorite team will be in the upcoming year. For many teams, the biggest moves have already been made. A flurry of activity happened at or around the Winter Meetings, and organizations have already committed to over $1 billion in free-agent contracts. The Blue Jays have been the most aggressive in locking down talent, notably signing Dylan Cease ($210 million, 7 years), Kazuma Okamoto ($60 million, 4 years), and Cody Ponce ($30 million, 3 years). Most other teams have made at least one big free agent acquisition or trade, but the Brewers have remained comparatively quiet. The only free agent Milwaukee has signed is Akil Baddoo, and the only trade they’ve made thus far sent Isaac Collins and Nick Mears to the Royals in exchange for Angel Zerpa. Neither move is expected to move the needle, which begs the question: What are they waiting for? It’s important to remember that this is how Milwaukee has operated in the offseason for quite some time now. The Brewers have never been huge fans of pursuing big-name free agents, who are often the first to get pulled off the board. They’re quite expensive, and the sheer amount of bidders for any given player often drives prices past the financial comfort zone of the front office. Many of the largest contracts in franchise history were extensions for players like Christian Yelich and Ryan Braun, making Lorenzo Cain’s $80 million contract signed in 2018 the largest free-agent deal Milwaukee has ever inked. Instead of simply throwing money at their problems, the Brewers love to find undervalued assets and bid low on them, relying on their outstanding internal player development and taking low-risk bets on players that others have already glossed over. In order to do this, deals are often struck late when the negotiating leverage shifts away from the player and towards any club willing to give them a chance. A few recent notable examples of late free agent signings include: Jose Quintana: Signed on March 5, 2025 Brandon Woodruff: Signed on February 21, 2024 Rhys Hoskins: Signed on January 26, 2024 Wade Miley: Signed on January 9, 2023 None of these four players was highly sought-after, and each came with an asterisk. For Woodruff and Hoskins, it was injury-related. It was understood that Woodruff would miss the entire 2024 season and part of the 2025 season, while Hoskins had just missed the entire 2023 season after tearing his ACL in spring training. For Miley and Quintana, it was age. Both starting pitchers were 36 years old when they signed their deals and seemed to be in the twilight of their big-league careers. These players were effective but only if you looked past the unappealing circumstances on the surface and were willing to take a chance (Hoskins may be the only exception, but hey, you can’t be right 100% of the time, that’s not fair for the other teams). Another factor that’s likely contributing to the Brewers’ sluggish pace of roster revamping is that their needs don't align well with what they’re willing to pay. There aren’t any major holes in the current roster and, barring a trade of someone like Freddy Peralta, all of the biggest contributors to the team’s success in 2025 will be along for the ride in 2026. However, if there were one aspect that could use some love, it’d be finding power in the lineup. In 2025, they ranked deceptively high in slugging percentage because their .258 batting average placed third in MLB, but they ranked 22nd in home runs (166) and 25th in ISO (.145). If Andrew Vaughn somehow manages to maintain his 141 OPS+ over the course of a full season, it may not be a problem, but precedent would suggest that outcome is unlikely. But these days, power doesn’t come cheap. Kyle Schwarber, an archetypal three-true-outcome player, returned to the Phillies for $150 million over five years. Pete Alonso signed a similar contract with the Orioles for $155 million over five years. There aren’t many slugging free agents left, and those that are available, like Kyle Tucker, are absolutely out of the Brewers’ price range. It’s a similar story with starting pitching. Milwaukee has a considerable number of young arms in the rotation. Still, if they want to pursue a veteran arm to back up Peralta, it would cost a considerable amount, either in cash or prospects. This seems like a big reason why they’ll look to retain Peralta this year, especially since he’ll be paid just $8 million to be the team’s ace. And so, their patience is understandable given their strategy. They’ll continue to wait until the marquee names are snatched up at a premium or full price, paving the way for the not great but still good players to be slowly and surely marked down with each passing week. Even if they don’t do anything, their roster remains solid, and their young core will only continue to improve. The one caveat to all this is that the other teams in the division aren’t quite so passive. The Cardinals have already made a handful of trades (albeit to enter an apparent rebuild), and the Cubs have made quite a few small moves to reinforce their bullpen. The most surprising organization has been the Pirates, who, aside from being interested in players like Schwarber, Josh Naylor, and Okamoto, picked up Ryan O'Hearn and Gregory Soto in free agency before also acquiring Brandon Lowe in a three-team trade. None of these moves is necessarily enough for the Brewers to fear for their position atop the NL Central yet, but at the same time, they can’t be totally ignored. Still, the front office tends to march to the beat of its own drum, regardless of what its closest rivals are up to. Realistically, the organization is likely biding its time and waiting to get what it needs at the right price. It may not happen soon, but something will happen eventually. Probably. View full article
-
:)
-
😬
-
Part 1: #21-25 Part 2: #16-20 15. Joey Ortiz, SS 2026 Season Age: 27 Controlled through: 2029 Jason’s Rank: 19 | Michael’s Rank: 10 | Steve’s Rank: 20 Although Ortiz wasn’t quite able to fill the shoes of Willy Adames as the Brewers’ starting shortstop, he still has considerable potential as a player. As you recall, he came over to Milwaukee along with DL Hall from Baltimore in exchange for Corbin Burnes and carried high expectations as Baltimore’s eighth-ranked prospect in 2023. His rookie year lived up to the hype, posting 3.2 fWAR across 142 games while playing third base. Unfortunately, the sophomore slump was absolutely real for Ortiz. Depending on which defensive metric you look at, he was either outstanding (12 OAA, 10 FRV) or slightly below average (-2 DRS). His offensive production was less debatable with his 67 wRC+, the third-lowest mark of qualified MLB players. It would be surprising if his offensive struggles became a long-term issue, but it’d absolutely be a question mark for any teams that would consider acquiring him. He’s young, has plenty of team control left, and is capable of playing great defense, but the uncertainty surrounding his bat prevents him from being more valuable than some of the other young talents in Milwaukee’s system. 14. Chad Patrick, RHP 2026 Season Age: 27 Controlled through: 2031 Jason’s Rank: 13 | Michael’s Rank: 14 | Steve’s Rank: 14 Patrick may have exceeded your expectations in his rookie year. He was the return package from the Athletics in exchange for Abraham Toro, and his 2025 numbers alone might have been enough to classify that deal as a resounding success. He pitched to a 3.53 ERA with a 3.53 FIP over 119 ⅔ innings and placed seventh in NL ROY voting. He found immense success using a variety of fastballs but struggled to be as effective with his breaking or offspeed offerings. However, Stuff+ does grade his slider and changeup very highly. In fact, he had the highest Stuff+ (105) of any pitcher on the team with more than 100 innings. This may be surprising as his fastball velocity is average, but with tricky shapes and movement, he’s able to get by just fine. He’d be a strong addition to the rotations of most teams, but because of his inexperience, he may not be as compelling a frontline starter as some other arms on the Brewers’ pitching staff. At the very least, he should see an elevated role with the team in 2026, where he could continue to increase his player stock. 13. Abner Uribe, RHP 2026 Season Age: 25 Controlled through: 2030 Jason’s Rank: 7 | Michael’s Rank: 19 | Steve’s Rank: 12 Over the past few years, whispers have spoken of top-secret human experiments being conducted in Milwaukee to produce elite catching and pitching talent. This has been used to explain the sudden and unexpected turnarounds for defensively deficient catchers and down-on-their-luck pitchers. I can’t personally speak to the existence of such lab but it’s getting harder to deny that if nothing else, the Brewers sure know how to make a closer. Trevor Megill, Devin Williams, Josh Hader, heck, even Corey Knebel had a 1.78 ERA and 39 saves in 2017. It’s a suspiciously long run of high-leverage dominance from the bullpen, and Abner Uribe is the lab’s most recent product. After a shaky 2024 marred by injury and poor on-field antics, he locked back in by replicating his rookie year numbers over a larger sample size of 75 ⅓ innings. His peripherals are absolutely off the charts. The only Statcast metrics in which he doesn’t rank in the top decile of qualified pitchers are chase rate (28.3%), walk rate (9.1%), and extension (6.4). He only accumulated a few saves, but he primarily pitched in high leverage, and the Brewers are clearly grooming him to eventually take the ball in the ninth inning. He might need a little more time before he’s ready to join the current inner circle of elite closers, but he’d be worth quite a bit to many teams around MLB today. It also helps that he has one of the best save celebrations around. 12. Christian Yelich, OF/DH 2026 Season Age: 34 Controlled through: 2028 Jason’s Rank: N/A | Michael’s Rank: 8 | Steve’s Rank: 4 He’s far from being the MVP finalist he was in the late 2010s, but Yelich has been consistent over the past four years. He continues to be one of the more productive bats on the team, and 2025 seems like he was able to carry over some of the success he had in 2024 before being sidelined by injury. The most encouraging sign from this past season was his increase in power. His slugging percentage of .452 is the highest mark since 2019, albeit not by much. What’s more exciting is the 29 home runs he hit in 2025, the first time he’s crossed the 20-homer mark since 2019. Despite this small but important career resurgence, Yelich’s position as a trade asset is complicated by his age and remaining value on his contract. According to Cot’s Contracts, he’s still owed ~$72 million over the next three years, which is a hefty sum for any player, let alone one that is clearly past his prime. Nonetheless, he probably has a few more productive seasons left in him. 11. Trevor Megill, RHP 2026 Season Age: 32 Controlled through: 2027 Jason’s Rank: 9 | Michael’s Rank: 18 | Steve’s Rank: 10 It’s not easy being 6’8", or so I’ve heard. Megill makes it work somehow, and as a guy who regularly throws more than 100 mph with a hammer knuckle curve, it probably works to his advantage. After two rough years with the Cubs and Twins, Megill was acquired for a player to be named later and cash in April 2023. It took some time to figure it out, but after Devin Williams sustained an injury in 2024 and left for the Yankees in 2025, he stepped into the closer role, where he has done a great job. Unlike the younger pitching assets Milwaukee seems to have an excess of, Megill already has four years of service time, which means he has fewer years of team control but also has a good amount of big-league innings under his belt. Additionally, he was paid just under $2 million in 2025, a very team-friendly price for what they got out of him. He’ll earn more as he heads into his second year of arbitration, but he’ll still come cheaper than the other closer options of his caliber. Teams wanting a high-leverage arm out of the box could look at a Trevor Megill as a plug-and-play option that may not need the same development resources as someone less tenured. He may not be a totally baked cake at this point, but he knows what he’s capable of and what he needs to do to get there. View full article
-
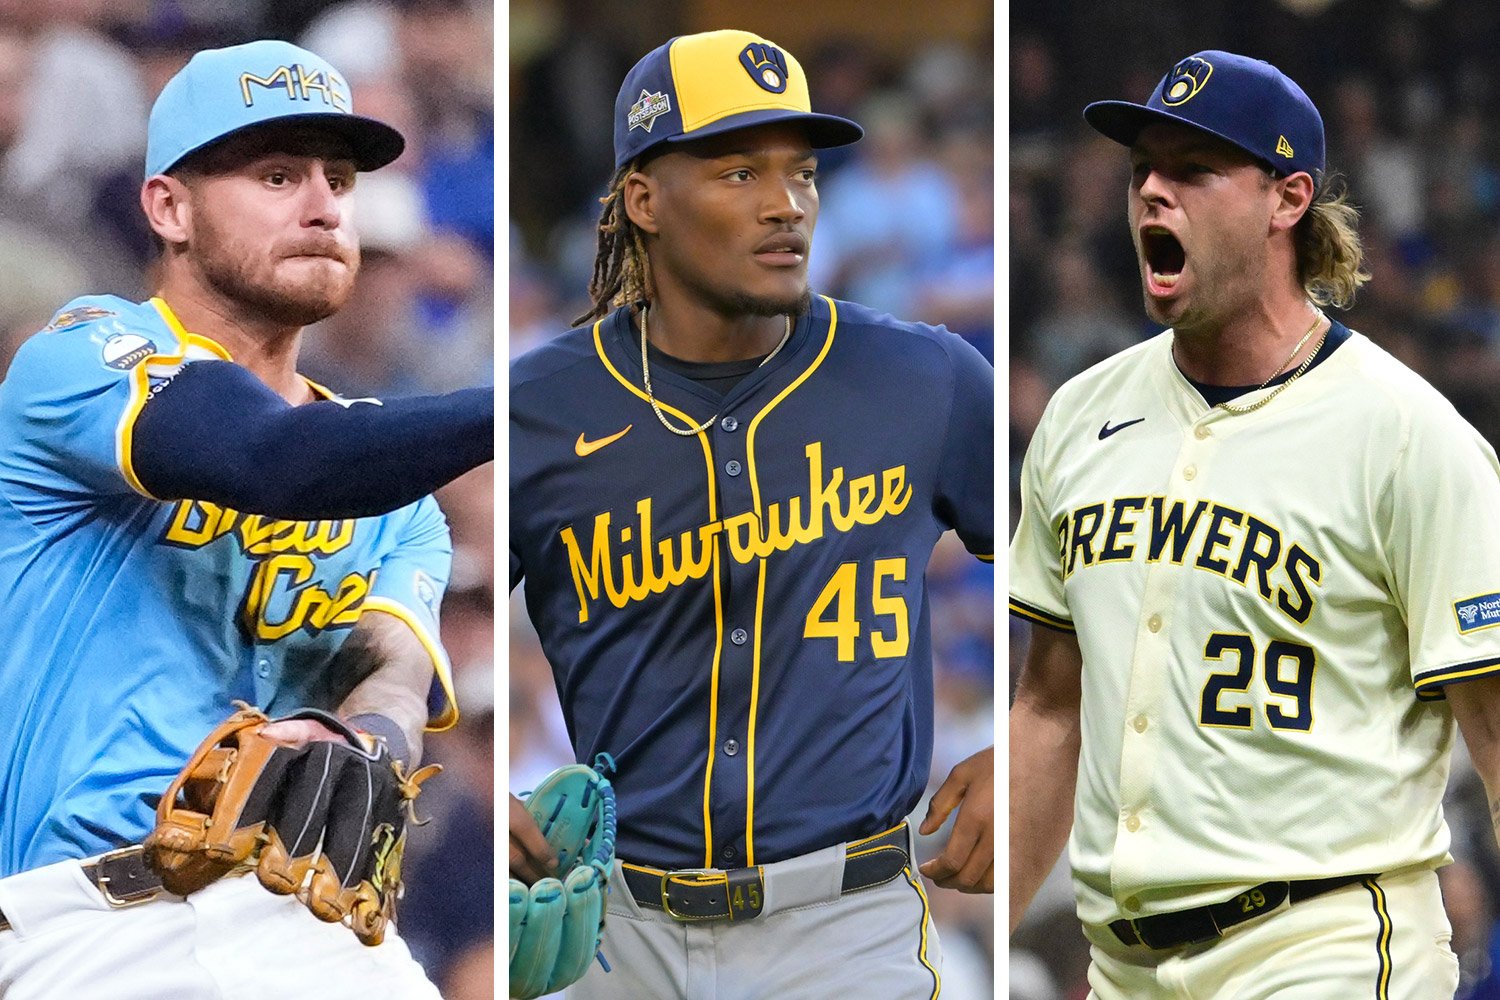 Part 1: #21-25 Part 2: #16-20 15. Joey Ortiz, SS 2026 Season Age: 27 Controlled through: 2029 Jason’s Rank: 19 | Michael’s Rank: 10 | Steve’s Rank: 20 Although Ortiz wasn’t quite able to fill the shoes of Willy Adames as the Brewers’ starting shortstop, he still has considerable potential as a player. As you recall, he came over to Milwaukee along with DL Hall from Baltimore in exchange for Corbin Burnes and carried high expectations as Baltimore’s eighth-ranked prospect in 2023. His rookie year lived up to the hype, posting 3.2 fWAR across 142 games while playing third base. Unfortunately, the sophomore slump was absolutely real for Ortiz. Depending on which defensive metric you look at, he was either outstanding (12 OAA, 10 FRV) or slightly below average (-2 DRS). His offensive production was less debatable with his 67 wRC+, the third-lowest mark of qualified MLB players. It would be surprising if his offensive struggles became a long-term issue, but it’d absolutely be a question mark for any teams that would consider acquiring him. He’s young, has plenty of team control left, and is capable of playing great defense, but the uncertainty surrounding his bat prevents him from being more valuable than some of the other young talents in Milwaukee’s system. 14. Chad Patrick, RHP 2026 Season Age: 27 Controlled through: 2031 Jason’s Rank: 13 | Michael’s Rank: 14 | Steve’s Rank: 14 Patrick may have exceeded your expectations in his rookie year. He was the return package from the Athletics in exchange for Abraham Toro, and his 2025 numbers alone might have been enough to classify that deal as a resounding success. He pitched to a 3.53 ERA with a 3.53 FIP over 119 ⅔ innings and placed seventh in NL ROY voting. He found immense success using a variety of fastballs but struggled to be as effective with his breaking or offspeed offerings. However, Stuff+ does grade his slider and changeup very highly. In fact, he had the highest Stuff+ (105) of any pitcher on the team with more than 100 innings. This may be surprising as his fastball velocity is average, but with tricky shapes and movement, he’s able to get by just fine. He’d be a strong addition to the rotations of most teams, but because of his inexperience, he may not be as compelling a frontline starter as some other arms on the Brewers’ pitching staff. At the very least, he should see an elevated role with the team in 2026, where he could continue to increase his player stock. 13. Abner Uribe, RHP 2026 Season Age: 25 Controlled through: 2030 Jason’s Rank: 7 | Michael’s Rank: 19 | Steve’s Rank: 12 Over the past few years, whispers have spoken of top-secret human experiments being conducted in Milwaukee to produce elite catching and pitching talent. This has been used to explain the sudden and unexpected turnarounds for defensively deficient catchers and down-on-their-luck pitchers. I can’t personally speak to the existence of such lab but it’s getting harder to deny that if nothing else, the Brewers sure know how to make a closer. Trevor Megill, Devin Williams, Josh Hader, heck, even Corey Knebel had a 1.78 ERA and 39 saves in 2017. It’s a suspiciously long run of high-leverage dominance from the bullpen, and Abner Uribe is the lab’s most recent product. After a shaky 2024 marred by injury and poor on-field antics, he locked back in by replicating his rookie year numbers over a larger sample size of 75 ⅓ innings. His peripherals are absolutely off the charts. The only Statcast metrics in which he doesn’t rank in the top decile of qualified pitchers are chase rate (28.3%), walk rate (9.1%), and extension (6.4). He only accumulated a few saves, but he primarily pitched in high leverage, and the Brewers are clearly grooming him to eventually take the ball in the ninth inning. He might need a little more time before he’s ready to join the current inner circle of elite closers, but he’d be worth quite a bit to many teams around MLB today. It also helps that he has one of the best save celebrations around. 12. Christian Yelich, OF/DH 2026 Season Age: 34 Controlled through: 2028 Jason’s Rank: N/A | Michael’s Rank: 8 | Steve’s Rank: 4 He’s far from being the MVP finalist he was in the late 2010s, but Yelich has been consistent over the past four years. He continues to be one of the more productive bats on the team, and 2025 seems like he was able to carry over some of the success he had in 2024 before being sidelined by injury. The most encouraging sign from this past season was his increase in power. His slugging percentage of .452 is the highest mark since 2019, albeit not by much. What’s more exciting is the 29 home runs he hit in 2025, the first time he’s crossed the 20-homer mark since 2019. Despite this small but important career resurgence, Yelich’s position as a trade asset is complicated by his age and remaining value on his contract. According to Cot’s Contracts, he’s still owed ~$72 million over the next three years, which is a hefty sum for any player, let alone one that is clearly past his prime. Nonetheless, he probably has a few more productive seasons left in him. 11. Trevor Megill, RHP 2026 Season Age: 32 Controlled through: 2027 Jason’s Rank: 9 | Michael’s Rank: 18 | Steve’s Rank: 10 It’s not easy being 6’8", or so I’ve heard. Megill makes it work somehow, and as a guy who regularly throws more than 100 mph with a hammer knuckle curve, it probably works to his advantage. After two rough years with the Cubs and Twins, Megill was acquired for a player to be named later and cash in April 2023. It took some time to figure it out, but after Devin Williams sustained an injury in 2024 and left for the Yankees in 2025, he stepped into the closer role, where he has done a great job. Unlike the younger pitching assets Milwaukee seems to have an excess of, Megill already has four years of service time, which means he has fewer years of team control but also has a good amount of big-league innings under his belt. Additionally, he was paid just under $2 million in 2025, a very team-friendly price for what they got out of him. He’ll earn more as he heads into his second year of arbitration, but he’ll still come cheaper than the other closer options of his caliber. Teams wanting a high-leverage arm out of the box could look at a Trevor Megill as a plug-and-play option that may not need the same development resources as someone less tenured. He may not be a totally baked cake at this point, but he knows what he’s capable of and what he needs to do to get there.
- 13 comments
-
- 1
-
-
- joey ortiz
- chad patrick
- (and 3 more)


.png.317486a52585d8361e8143a012e76386.png)


