

FranchiseInsider
-
Posts
18 -
Joined
-
Last visited
Content Type
Profiles
Forums
Blogs
Events
News
2026 Milwaukee Brewers Top Prospects Ranking
Milwaukee Brewers Videos
2022 Milwaukee Brewers Draft Picks
Milwaukee Brewers Free Agent & Trade Rumors, Notes, & Tidbits
Guides & Resources
2023 Milwaukee Brewers Draft Picks
2024 Milwaukee Brewers Draft Picks
The Milwaukee Brewers Players Project
2025 Milwaukee Brewers Draft Pick Tracker
2026 Milwaukee Brewers Draft Tracker: Picks & Bonuses
Store
Downloads
Gallery
Everything posted by FranchiseInsider
-
As badly as the National League Central teams are playing on aggregate, at least the division is not the worst in baseball, thanks to their American League counterparts. The NL Central could break several different ways, with a few clubs demonstrating strong underlying performances at times throughout the year, and two division leaders fighting to sustain hot streaks. Is this the kind of division that warrants an all-in run, by anyone, at the deadline? Our beloved Milwaukee Brewers are playing solid baseball lately. Entering Tuesday's Independence Day matinee against the Cubs, they were on their seventh winning streak of the season. Overall, after a brutal losing streak took the club back to .500 (at 34-34), the Brewers have gone on a 12-5 tear, While their runs scored and runs allowed produced during this stretch are not as dominant as the 114-win pace suggested by a 12-5 record, the underlying performance is quite strong, at around 91 expected wins in a 162-game season. In short: Milwaukee is back, with perhaps their best prolonged stretch of the season in which both the bats and the run-prevention unit are better than average. The trouble with the NL Central is twofold. First, like every other team in the division, the Brewers have played as a relatively middling club for the majority of 2023, and it's difficult to guess where the club might land with their generally uneven play as demonstrated throughout the year. Second, even if the Brewers play at their best, it's difficult to see the club (or any other winner coming from the NL Central) as anything more than a Wild Card-caliber club. Given the general outlook of the standings and underlying performances, I do not envy the Brewers front office, as this is a year that the club could benefit from a quick reset by trading away the few contracts that could net impact prospect potential in return, while still remaining competitive in the division. After all, there are quite solid odds that someone can win the NL Central with as few as 82 to 86 wins. Let's take a quick tour around the standings and see why this is the case! All of these statistics are for the true halfway mark of the season, or game 81. Overall Actual Winner: Reds and Brewers tied, 86 Wins The good news for Brewers fans is they don't print Runs Scored / Runs Allowed records on pennants. In terms of actual winning outcomes, Milwaukee has held pace against the surging Cincinnati Reds thanks to their own recent 17-game strong stretch. Overall Pythagorean (Runs Scored / Runs Allowed) Expected Winner: Cubs, 86 Wins The poor Cubs wish that Pythagoras settled the divisional title: the Lakeview baseball club is riding a ridiculous 19-11 record in blowouts, according to Baseball Reference, producing a 199 RS / 148 RA record in those games. Why isn't the club's surface record as good? In one-run games, the Cubs are 7-11 (53 RS / 57 RA), meaning that in all other games they are 12-23 (129 RS / 154 RA). In short, when they are not involved in blow out wins or tight one-run contests, the Cubs are gravely underperforming their peripheral record. If you squint there's a competitive club in here, their timing is simply off. Last 20 Games Trend Winner: Cubs, 92 Wins This one surprised me: if you take each club's last 20 games Runs Scored / Runs Allowed and project that for their remaining games, the Cubs (92 wins) best the red-hot Reds (90 wins). Why does this occur? Even though the Reds' winning streak entering the mathematical midpoint was much better than the Cubs' actual streak (15-5 in their last 20 games, compared to 12-8 for the Cubs), the Reds had many more close wins than Chicago, and nearly as many bad losses. So one could argue the Reds' hot streak should be considered even better, because they were winning close games and playing more close games. Pythagoras doesn't necessarily like how that looks, but this category should probably be considered a fluke for that reason: the Reds are king in this category where it counts. Daily Average Winner: Brewers, 89 Wins Why do I review a club's daily average winning pace throughout the season? Because it's interesting to see how certain teams either trend hotter or colder than their actual wins record, and it's also fun to look at teams' variance throughout the year. Milwaukee leads in this category, because of their exceptional start to the season. Daily Pythagorean Winner: Cubs, 94 Wins See above. This is a compounded daily average of the Cubs' issues described above. This is a club that is far out of balance, with an actual daily winning pace around 79 wins, but a daily Pythagorean record around 94 wins. Bad timing! Daily Average Last-20 Streaks Winner: Pirates, 80 Wins Now this is a wild category. If you average out each NL Central club's "Last 20" streaks for the season, meaning that you prorate their remaining games by using their last 20 games' Runs Scored / Runs Allowed trend, there is not a single winning club in the division. Why is this? Regular, prolonged stretches of mediocrity for each club. Let's look at this closer: entering play Tuesday, every NL Central club except the Cubs had 66 games in which you could calculate a full 20-game trend from the previous 20 games played (ex., take Game 20 through Game 85, for example). The Brewers played 42 of 66 projected 20-game trends at a sub-.500 pace; the Pirates played 41 such days at a sub-.500 pace; the Reds, 43; the Cardinals, 46; and the Cubs, 33; basically, when you project out how each of these clubs has played in their last twenty games and use that as a potential marker for their remaining season, the vast majority of the time each of these clubs is on a below-.500 trend. Not good! Blended Standings! Now, for no scientific reason whatsoever, let's take the harmonic mean of actual wins and Pythagorean wins, to project the NL Central division winner: Reds 81.9 Brewers 80.9 Cubs 80.9 Pirates 76.3 Cardinals 72.0 If you are Brewers General Manager Matt Arnold, is this the club (or division) that you're spending prospect capital to win? Are you staying put and holding everything steady? Or are you taking the chance to make some shrewd selling moves, gambling on winning 82 to 86 games and sneaking into the postseason anyway? View full article
-
 Our beloved Milwaukee Brewers are playing solid baseball lately. Entering Tuesday's Independence Day matinee against the Cubs, they were on their seventh winning streak of the season. Overall, after a brutal losing streak took the club back to .500 (at 34-34), the Brewers have gone on a 12-5 tear, While their runs scored and runs allowed produced during this stretch are not as dominant as the 114-win pace suggested by a 12-5 record, the underlying performance is quite strong, at around 91 expected wins in a 162-game season. In short: Milwaukee is back, with perhaps their best prolonged stretch of the season in which both the bats and the run-prevention unit are better than average. The trouble with the NL Central is twofold. First, like every other team in the division, the Brewers have played as a relatively middling club for the majority of 2023, and it's difficult to guess where the club might land with their generally uneven play as demonstrated throughout the year. Second, even if the Brewers play at their best, it's difficult to see the club (or any other winner coming from the NL Central) as anything more than a Wild Card-caliber club. Given the general outlook of the standings and underlying performances, I do not envy the Brewers front office, as this is a year that the club could benefit from a quick reset by trading away the few contracts that could net impact prospect potential in return, while still remaining competitive in the division. After all, there are quite solid odds that someone can win the NL Central with as few as 82 to 86 wins. Let's take a quick tour around the standings and see why this is the case! All of these statistics are for the true halfway mark of the season, or game 81. Overall Actual Winner: Reds and Brewers tied, 86 Wins The good news for Brewers fans is they don't print Runs Scored / Runs Allowed records on pennants. In terms of actual winning outcomes, Milwaukee has held pace against the surging Cincinnati Reds thanks to their own recent 17-game strong stretch. Overall Pythagorean (Runs Scored / Runs Allowed) Expected Winner: Cubs, 86 Wins The poor Cubs wish that Pythagoras settled the divisional title: the Lakeview baseball club is riding a ridiculous 19-11 record in blowouts, according to Baseball Reference, producing a 199 RS / 148 RA record in those games. Why isn't the club's surface record as good? In one-run games, the Cubs are 7-11 (53 RS / 57 RA), meaning that in all other games they are 12-23 (129 RS / 154 RA). In short, when they are not involved in blow out wins or tight one-run contests, the Cubs are gravely underperforming their peripheral record. If you squint there's a competitive club in here, their timing is simply off. Last 20 Games Trend Winner: Cubs, 92 Wins This one surprised me: if you take each club's last 20 games Runs Scored / Runs Allowed and project that for their remaining games, the Cubs (92 wins) best the red-hot Reds (90 wins). Why does this occur? Even though the Reds' winning streak entering the mathematical midpoint was much better than the Cubs' actual streak (15-5 in their last 20 games, compared to 12-8 for the Cubs), the Reds had many more close wins than Chicago, and nearly as many bad losses. So one could argue the Reds' hot streak should be considered even better, because they were winning close games and playing more close games. Pythagoras doesn't necessarily like how that looks, but this category should probably be considered a fluke for that reason: the Reds are king in this category where it counts. Daily Average Winner: Brewers, 89 Wins Why do I review a club's daily average winning pace throughout the season? Because it's interesting to see how certain teams either trend hotter or colder than their actual wins record, and it's also fun to look at teams' variance throughout the year. Milwaukee leads in this category, because of their exceptional start to the season. Daily Pythagorean Winner: Cubs, 94 Wins See above. This is a compounded daily average of the Cubs' issues described above. This is a club that is far out of balance, with an actual daily winning pace around 79 wins, but a daily Pythagorean record around 94 wins. Bad timing! Daily Average Last-20 Streaks Winner: Pirates, 80 Wins Now this is a wild category. If you average out each NL Central club's "Last 20" streaks for the season, meaning that you prorate their remaining games by using their last 20 games' Runs Scored / Runs Allowed trend, there is not a single winning club in the division. Why is this? Regular, prolonged stretches of mediocrity for each club. Let's look at this closer: entering play Tuesday, every NL Central club except the Cubs had 66 games in which you could calculate a full 20-game trend from the previous 20 games played (ex., take Game 20 through Game 85, for example). The Brewers played 42 of 66 projected 20-game trends at a sub-.500 pace; the Pirates played 41 such days at a sub-.500 pace; the Reds, 43; the Cardinals, 46; and the Cubs, 33; basically, when you project out how each of these clubs has played in their last twenty games and use that as a potential marker for their remaining season, the vast majority of the time each of these clubs is on a below-.500 trend. Not good! Blended Standings! Now, for no scientific reason whatsoever, let's take the harmonic mean of actual wins and Pythagorean wins, to project the NL Central division winner: Reds 81.9 Brewers 80.9 Cubs 80.9 Pirates 76.3 Cardinals 72.0 If you are Brewers General Manager Matt Arnold, is this the club (or division) that you're spending prospect capital to win? Are you staying put and holding everything steady? Or are you taking the chance to make some shrewd selling moves, gambling on winning 82 to 86 games and sneaking into the postseason anyway?
 -
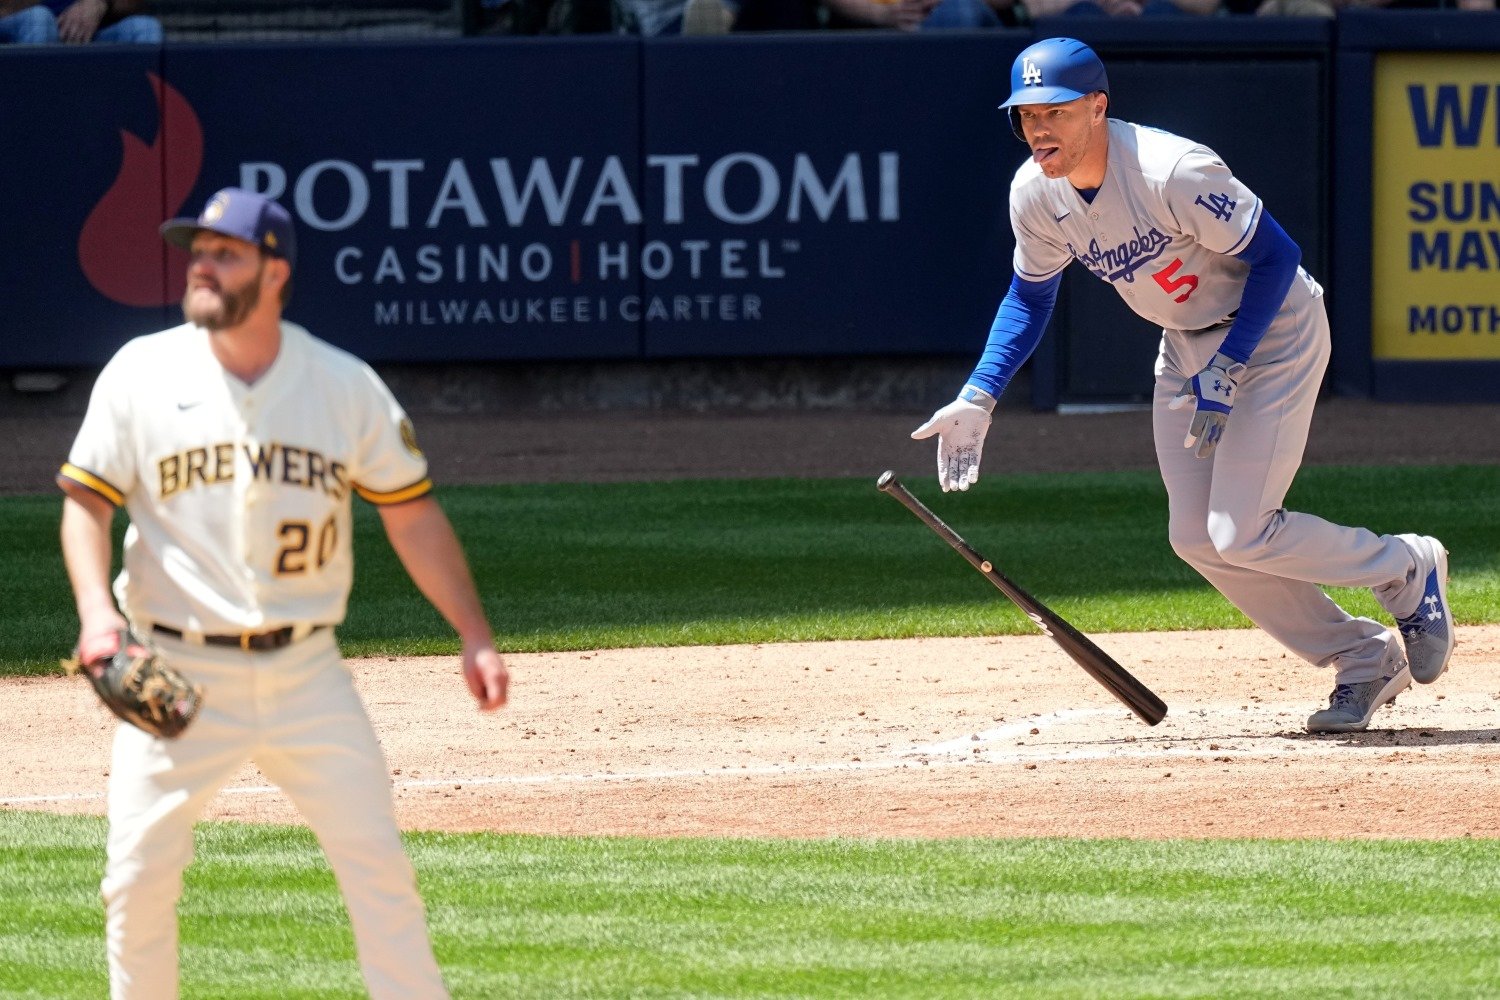
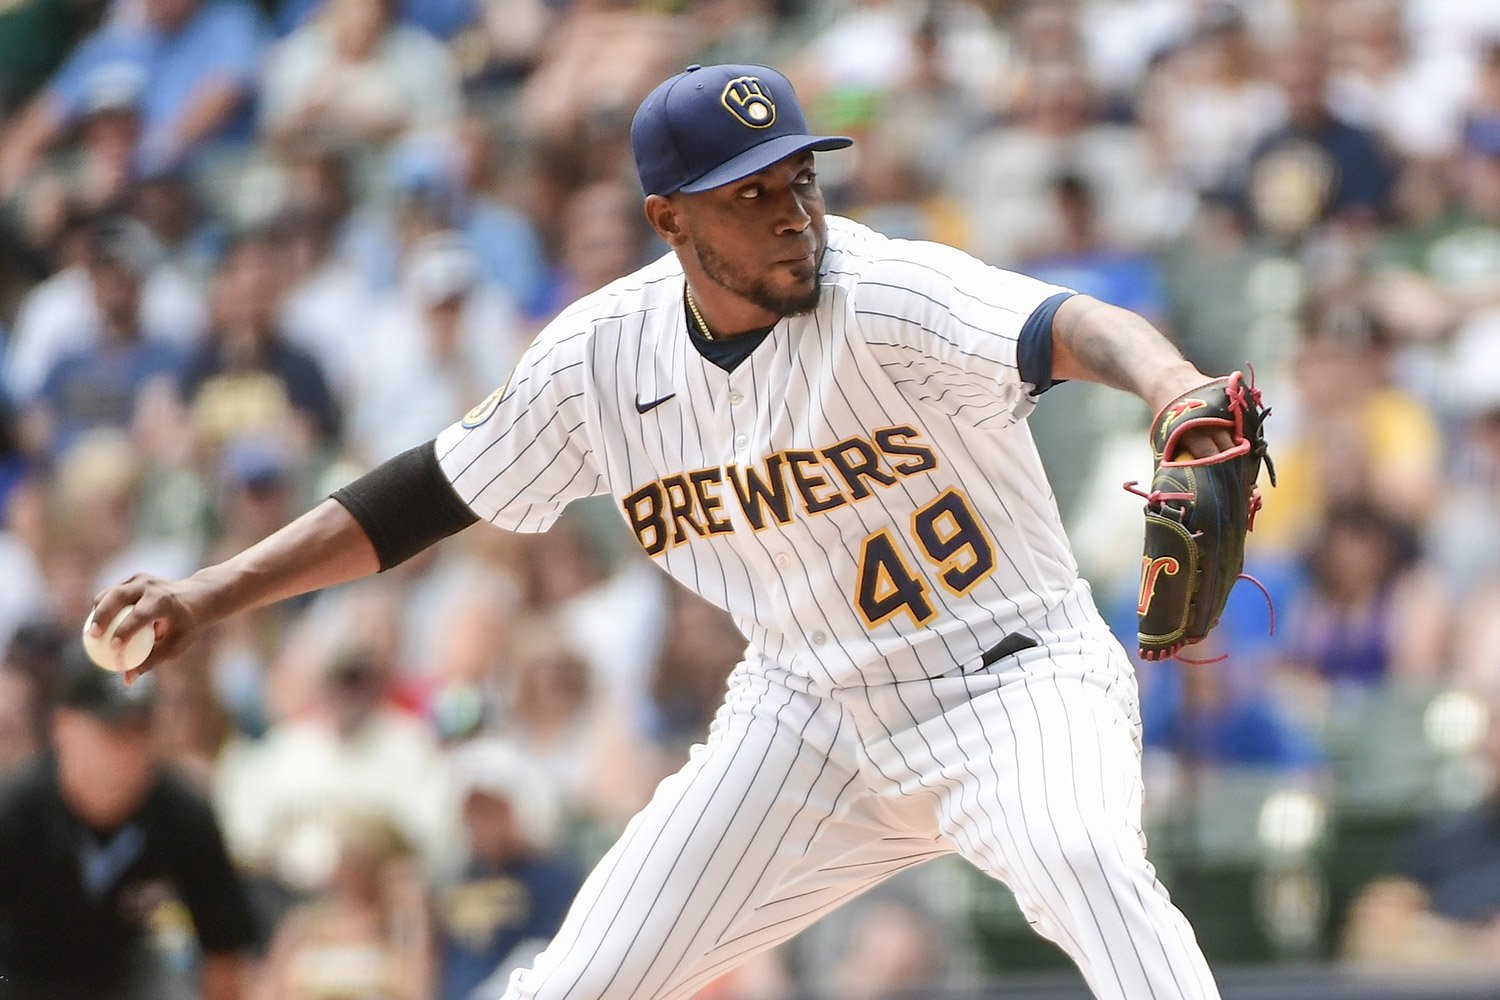 As I wrote yesterday, the Brewers are in the middle of a rough stretch, and one of the most difficult aspects has been their starting pitching performance. While the team has faced injuries in general, it's difficult not to focus especially on the harm that losing early success story Wade Miley caused to the rotation, as well as the disappearance of Eric Lauer; the continued injury list seat for Brandon Woodruff; and the lack of use for Janson Junk (who the biggest boosters of the Hunter Renfroe trade claimed was a key rotation depth improvement for a weak rotation in 2022). Of course, as frustrating as the injuries and middling performances have been, the rotation took a turn last month. Thanks in large part to quality depth performances, this rotation could sustain a .500 ballclub for the time being. ICYMI: Junkball Blues 1 ICYMI: Junkball Blues 2 The pitching rotation is receiving quite laudable performances from their depth starters, such as Adrian Houser and Colin Rea. New entry Julio Teheran is stealing the scene with four crucial replacement starts. Teheran climbed the ladder from true replacement starter (1 game started immediately upon signing day) to a near-depth role on the club (he's already got twice as many games started as Brandon Woodruff!). If you truly want to know how the 2023 Brewers season is going, you can check out the last month of the main core rotation, which went 84.3 innings and -7 runs prevented (basically, seven runs below average) over 15 starts. Prorating this workload for an entire season, this rotation core would be nearly 40 runs below average (turning a .500 team into a 77-to-78-win club). It's difficult to watch the previous strength of recent Brewers clubs vanish completely. However, it is hardly fair to group the full rotation core together since the last update (roughly one month of work). The group split 40.3 and -15 runs prevented for the trio of Miley / Peralta / Lauer but also received 44 IP and eight runs prevented for Corbin Burnes. Burnes saved the rotation over the last month and is slowly returning to form in terms of consistent quality results. Wade Miley: THEN: 4 runs prevented (7 GS / 40.0 IP) / NOW: 4 runs prevented (8 GS / 41.7 IP) Freddy Peralta: THEN: 5 runs prevented (7 GS / 40.7 IP) / NOW: -7 runs prevented (13 GS / 70.3 IP) Eric Lauer: THEN: -6 runs prevented (7 GS / 34.3 IP) / NOW: -9 runs prevented (9 G / 42.7 IP) Corbin Burnes: THEN: -1 runs prevented (7 GS / 39.7 IP) / NOW: 7 runs prevented (14 GS / 83.7 IP) Meanwhile, what was previously known as the periphery of the rotation worked 16 games started over the same period (84.7 IP and eight runs prevented). The depth guys matched the workload of the main starters and trounced them in terms of performance. It's not just Teheran; Houser and Rea have done nice jobs in in-depth roles. NEW ENTRY!!! Julio Teheran: 7 runs prevented (4 GS / 24.3 IP) Colin Rea: THEN: -1 runs prevented (5 GS / 27.3 IP) / NOW: -0 runs prevented (12 G / 57.3 IP) Adrian Houser: THEN: +0 runs prevented (1 GS / 4.7 IP) / NOW: +0 runs prevented (7 GS / 35.3 IP) NO CHANGE Brandon Woodruff: 4 runs prevented (2 GS / 11.3 IP) NO CHANGE Janson Junk: -3 runs prevented (1 GS / 4.7 IP) All told, the Brewers rotation has worked just about average innings over the last month, which is one of the reasons the club has been playing so many close games. Now that Corbin Burnes has turned a corner, it remains to be seen if Freddy Peralta can readjust. For as much as both pitchers have had crucial sequences of strength for the rotation, it is difficult to see this Brewers team sustaining a competitive status if both Peralta and Burnes are seesawing good and bad performances with one another.
 -
Which one of you had Julio Teheran matching Corbin Burnes in terms of Runs Prevented in 2023? Will the 2023 Brewers playoff squad still feature a Burnes / Teheran 1-2 punch? I can't write a better hook than this! Let's enjoy another look at the rotation because I might not be able to use this line again. Image courtesy of © Benny Sieu-USA TODAY Sports As I wrote yesterday, the Brewers are in the middle of a rough stretch, and one of the most difficult aspects has been their starting pitching performance. While the team has faced injuries in general, it's difficult not to focus especially on the harm that losing early success story Wade Miley caused to the rotation, as well as the disappearance of Eric Lauer; the continued injury list seat for Brandon Woodruff; and the lack of use for Janson Junk (who the biggest boosters of the Hunter Renfroe trade claimed was a key rotation depth improvement for a weak rotation in 2022). Of course, as frustrating as the injuries and middling performances have been, the rotation took a turn last month. Thanks in large part to quality depth performances, this rotation could sustain a .500 ballclub for the time being. ICYMI: Junkball Blues 1 ICYMI: Junkball Blues 2 The pitching rotation is receiving quite laudable performances from their depth starters, such as Adrian Houser and Colin Rea. New entry Julio Teheran is stealing the scene with four crucial replacement starts. Teheran climbed the ladder from true replacement starter (1 game started immediately upon signing day) to a near-depth role on the club (he's already got twice as many games started as Brandon Woodruff!). If you truly want to know how the 2023 Brewers season is going, you can check out the last month of the main core rotation, which went 84.3 innings and -7 runs prevented (basically, seven runs below average) over 15 starts. Prorating this workload for an entire season, this rotation core would be nearly 40 runs below average (turning a .500 team into a 77-to-78-win club). It's difficult to watch the previous strength of recent Brewers clubs vanish completely. However, it is hardly fair to group the full rotation core together since the last update (roughly one month of work). The group split 40.3 and -15 runs prevented for the trio of Miley / Peralta / Lauer but also received 44 IP and eight runs prevented for Corbin Burnes. Burnes saved the rotation over the last month and is slowly returning to form in terms of consistent quality results. Wade Miley: THEN: 4 runs prevented (7 GS / 40.0 IP) / NOW: 4 runs prevented (8 GS / 41.7 IP) Freddy Peralta: THEN: 5 runs prevented (7 GS / 40.7 IP) / NOW: -7 runs prevented (13 GS / 70.3 IP) Eric Lauer: THEN: -6 runs prevented (7 GS / 34.3 IP) / NOW: -9 runs prevented (9 G / 42.7 IP) Corbin Burnes: THEN: -1 runs prevented (7 GS / 39.7 IP) / NOW: 7 runs prevented (14 GS / 83.7 IP) Meanwhile, what was previously known as the periphery of the rotation worked 16 games started over the same period (84.7 IP and eight runs prevented). The depth guys matched the workload of the main starters and trounced them in terms of performance. It's not just Teheran; Houser and Rea have done nice jobs in in-depth roles. NEW ENTRY!!! Julio Teheran: 7 runs prevented (4 GS / 24.3 IP) Colin Rea: THEN: -1 runs prevented (5 GS / 27.3 IP) / NOW: -0 runs prevented (12 G / 57.3 IP) Adrian Houser: THEN: +0 runs prevented (1 GS / 4.7 IP) / NOW: +0 runs prevented (7 GS / 35.3 IP) NO CHANGE Brandon Woodruff: 4 runs prevented (2 GS / 11.3 IP) NO CHANGE Janson Junk: -3 runs prevented (1 GS / 4.7 IP) All told, the Brewers rotation has worked just about average innings over the last month, which is one of the reasons the club has been playing so many close games. Now that Corbin Burnes has turned a corner, it remains to be seen if Freddy Peralta can readjust. For as much as both pitchers have had crucial sequences of strength for the rotation, it is difficult to see this Brewers team sustaining a competitive status if both Peralta and Burnes are seesawing good and bad performances with one another. View full article
-
 Throughout the Brewers' season, I have noticed that this club will absolutely scratch and claw its way through games with teams of suspect quality. Take their most recent losing streak to the Athletics, undoubtedly one of the worst symbolic series Brewers fans have experienced since the unspeakable collapse in late 2014. Their losses? 2-5, 1-2, 6-8. Not that bad, certainly worse in terms of symbolism than performance. A similar thing happened against the Cincinnati Reds, this time with a blend of close wins and close losses: 5-4, 10-8, 0-2. The same thing has happened in Minneapolis over the last two hopefully-forgettable days (5-7, 2-4). Nine of the last 15 Brewers games have been decided by a margin of two (or fewer) runs, and another two were decided by a margin of three. And so it goes that a club with a 6-9 record in their last 15 games, a stretch which includes their second six-game (so far) losing streak of the season, also has a Runs Scored / Runs Allowed performance of 60 RS / 64 RA in those games. In terms of the ledger, where the wins truly count, this recent Brewers stretch is good for a 65-win pace, while their underlying performance is good for a 76-win pace; which is ... better? One could argue that the Brewers are getting a lot of mileage out of that 10-2 victory against the Orioles to impact their perception of competitiveness over the last 15 games, so I removed the two "blowout" games where margins of loss or victory were bigger than five runs. Even in this scenario, the Brewers' underlying performance (48 RS / 55 RA, 71 win pace) was better than their actual performance (5-8, good for a 62-win pace). Of course, any way you look at win totals of 76 and 71, or 65 and 62, the recent results are not up to the standards that recent Brewers fans have come to hold for their team. And it's just not good baseball. Throughout the season, I like to track a team's daily wins and losses and their Runs Scored / Runs Allowed within the league context to understand specific trends pertaining to their season. The basic hypothesis is that many teams exist within one roster throughout a season, and there are also wide margins of error on the expectations of even one roster of players. When you add up streaks and slumps, injuries, call-ups, trades, and other roster moves, many different iterations of each MLB club take the field over 162 games. I like to try to find those shifts. Recently, as you are probably already aware, the Brewers are in the midst of a frustrating six-game losing streak. It is tied for their longest losing streak of the season, which I mentioned above, and it is their fifth losing streak. For purposes here, I define a streak as 3-or-more consecutive wins (or losses). The Brewers also have five winning streaks in 2023, so we are looking at a quite streaky team. In fact, nearly sixty percent of the club's 68 games thus far have occurred during a winning or losing streak. During their five winning and five losing streaks, the Brewers thus far have posted a 19-21 record, which is slightly worse than their overall 34-34 winning percentage. In terms of underlying performance, the club is 163 Runs Scored / 173 Runs Allowed, which is good for a 76-to-77 win pace and better than the club's overall run differential. By contrast, when the Brewers are not playing during a winning or losing streak, those "in-between" or transitional games feature a 15-13 record, which is better than their overall 34-34 mark. What is curious here, however, is that the club actually plays worse when they are not in the middle of a winning or losing streak: here, their scoreboard showed 111 RS / 126 RA, which is good for a 71-to-72 win pace, and notably worse than their overall run differential for 2023. What's going on here? In general, Milwaukee has had quite competitive losing streaks. During their 21 losses amid losing streaks, the club only posted 4 "blowout" (5+ run) losses. By contrast, of their 13 random "transitional" game losses (or losses that did not occur during a losing streak), the Brewers posted 6 "blowout" losses. Our beloved Milwaukee Brewers are running through a tough stretch, demonstrating many flaws that have made this a frustrating year. The offense can't score runs, the elite starting pitching factory has seemingly closed up shop and moved out of town, and the bullpen is suddenly stumbling as the starting pitching staff underperforms. But if your perception is that Milwaukee remains in a lot of close games, even if those games are frustrating, that intuition seems to be correct, and it leads me to wonder whether a few quick roster tweaks could yield fast and impactful results on the field. Acquiring another arm or two at the deadline (or earlier) and seeking out a deadline bat could go a long way to translate some of these close losses into wins. What is most interesting about these results is perhaps the perception of a club that fights. Despite their losing streaks, the club does not get blown out, which I take as a sign that they are bouncing back and strategically focusing on the right things to keep them close to winning. Right now, those wins are not occurring. Of course, all of the run differentials I posted above are subpar compared with the expectations of a winning club, so the club needs to improve even if they have demonstrated that they will not stop scratching and clawing. Now it's time for the Brewers front office to take their step forward in aiding these scrappy dudes by recognizing the roster's apparent shortcomings and spending some of Mark Attanasio's cash on midseason improvements.
 -
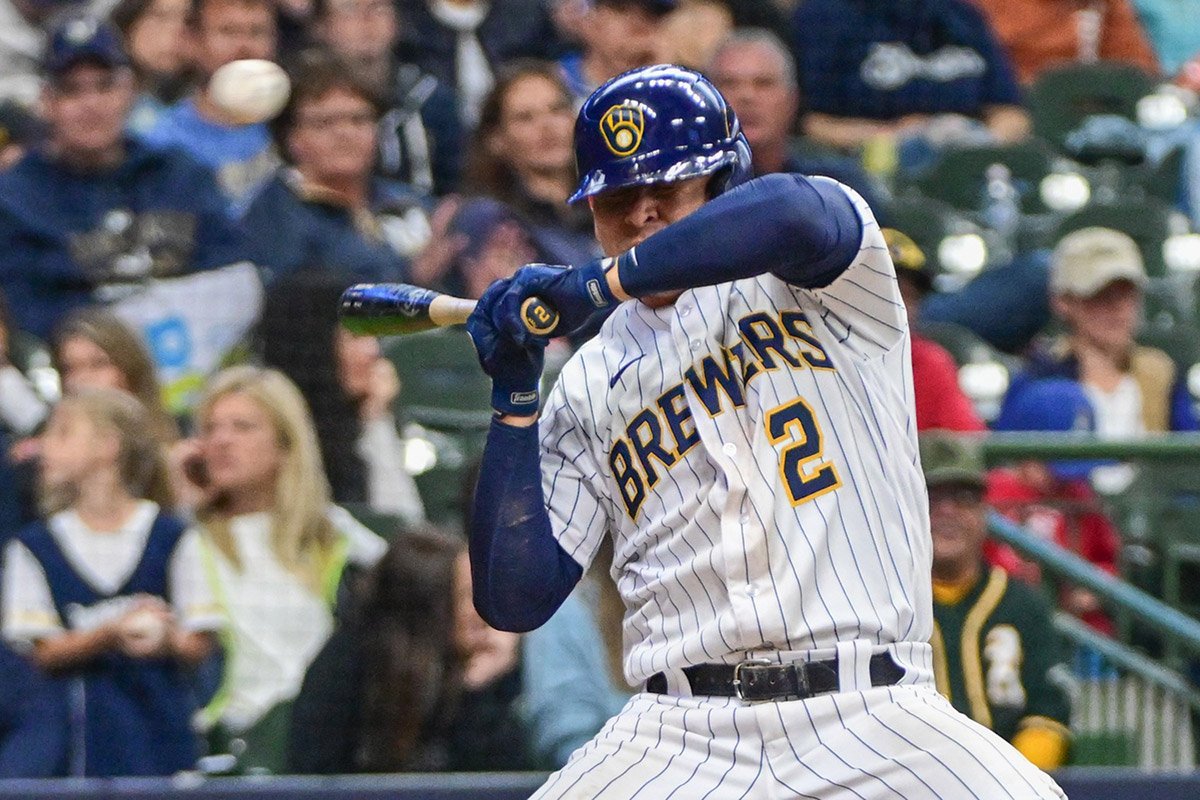
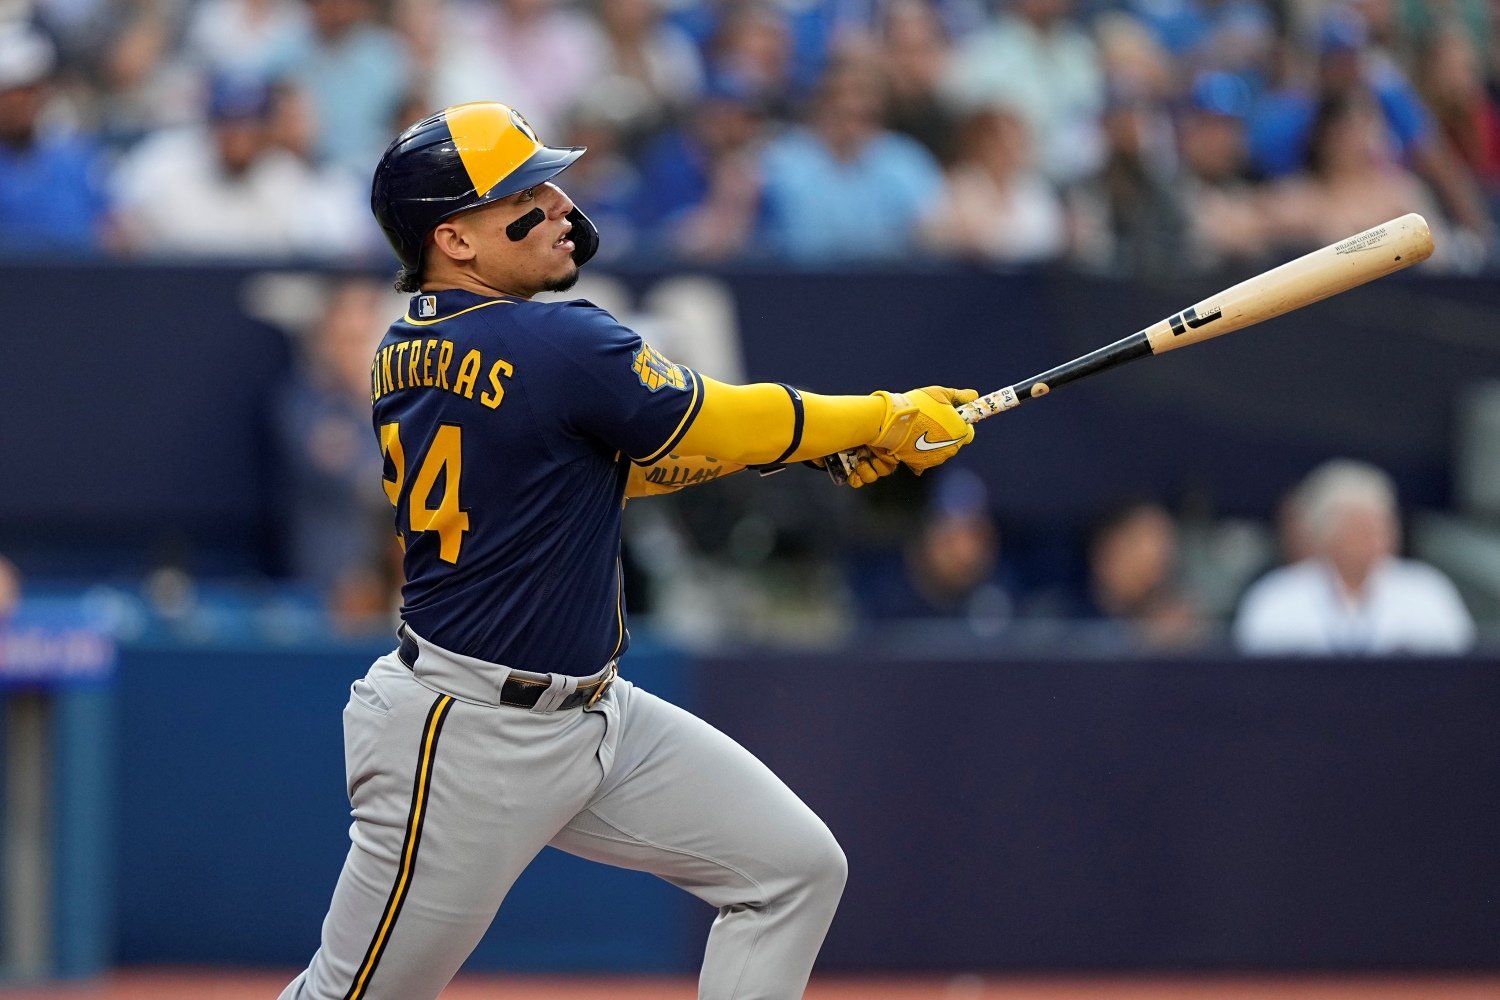 It's hard not to cheer for Brice Turang and Joey Wiemer. The dynamic duo from the Brewers' minor-league system offer a glimpse of hope for fans who love prospect hype, and a chance to see if the team's player development department can finally build an impact position player. Under former president David Stearns, the Brewers hardly used the draft and international amateur free agency to develop homegrown talent, and while the current club certainly relies heavily on trades and free agency, there is a contingency of fans who wish to see the team fit the mold of homegrown teambuilding. The arrivals of Turang and Wiemer (and Garrett Mitchell, prior to his injury) suggested that perhaps the club could get past the development woes of recent years and build the position player version of the Brandon Woodruff/Corbin Burnes pitching core. Unfortunately, it's not meant to be, at least not yet. Turang is currently slashing .215/.264/.315, good for a 76 Deserved Runs Created Plus (DRC+), which is a Baseball Prospectus statistic that uses contextual batting elements to estimate a player's expected offensive output. The bigger the number, the better, and a number above 100 means a player is average or better. Turang would be expected to produce at a level approximately 20 percent below league average. Wiemer's slash might look worse, with a .187/.249/.329 line, but his underlying elements suggest that he would be expected to produce around 12 percent below average (81 DRC+). It's hard not to look at Certified Large Man Hunter Renfroe's performance in Anaheim and wonder if the Brewers missed an opportunity to keep the most impactful pieces of their 2022 offense together, as Renfroe's current slash looks similar to last year's output and his DRC+ of 99 suggests that his bat is average. But it's not right to solely pick on Turang and Wiemer, who are merely rookies developing at the MLB level and thus far exhibiting traits that will help them keep work as suitable depth players. The trouble is that it's easy to look at the rookies as an indictment of a failed front office strategy, as even including injuries in the equation, it's arguable that General Manager Matt Arnold did not make enough moves to secure impact bats in the wake of losing Kolten Wong and Renfroe via trade (let alone losing Andrew McCutchen and Jace Peterson, who both provided a level of production in 2022 depth roles that the current club is missing). The simple problem with the 2023 Brewers club is that their batting order is not as deep with quality options as previous iterations were. By DRC+, the Brewers currently have four bats who would be expected to produce at solidly better than average levels (Christian Yelich at 115; Owen Miller at 110; William Contreras at 110; and Brian Anderson at 109). Believe it or not, that's better than the 2022 club, who could only really boast Rowdy Tellez (123 DRC+) and Renfroe (113 DRC+) as notably better than average options. The difference, however, was that the 2022 Brewers had another five bats hovering right around average, in Willy Adames, Luis Urias, Yelich, Wong, and McCutchen (all 97 to 103 DRC+). In 2023, that group contains Adames (101 DRC+), Victor Caratini (93 DRC+), and Mike Brosseau (96 DRC+). In short, the very best 2023 bats are not as good as the most elite 2022 Brewers bats, and the near-average bats are not as good, either. Last year, Adames, Urias, Yelich, and Wong were all average or slightly better; the Urias injury has ensured that only two of those have reprised their success. The shape of the Brewers offense is also worse in 2023 than 2022. Last Thursday night, the Brewers offense spoiled the excellent Milwaukee debut for Julio Teheran, an emergency pitcher who pitched like a 2018 Brewers ace (five innings pitched, one run allowed, fastball around 89 to 90 MPH, throwing a slider more than any other pitch). That glorious pitching effort was met by the seventh Brewers offensive shutout, good for 14 percent of the club's games thus far. For all the whining about the (sometimes truly frustrating, it's true) 2022 Brewers offense, that group produced zeroes on the scoreboard in 7 percent of their games. So, the 2023 Brewers club is giving their pitching staff no chance to win twice as frequently thus far. If you look at all low-output games (0 RS, 1 RS, 2 RS, and 3 RS, each of which is a clearly below average run total in either the 2022 or 2023 runs environment), the 2023 Brewers club has produced low-output in 46 percent of their games thus far; the 2022 club did so in roughly 41 percent of games--the major difference being, of course, that the 2022 Brewers low-output games skewed heavily toward 2 RS and 3 RS affairs (24 percent of games), while the 2023 Brewers low-output games skew heavily toward zeroes and ones (24 percent of games). Stated simply, in low output games in 2022, the Brewers bats scored 122 runs. Prorated for the same number of low output games, the 2023 Brewers would score only 95 runs in such contests. Not only are the Brewers performing at a worse level more frequently, they are even scoring fewer runs when they have low output games. Perhaps the worst part about all of this is that Yelich is starting to put together a truly nice season at the plate, and the club appears to have hit on Contreras (fingers crossed). Given the club's reserve rights for Contreras and the long contract for Yelich, that's the start of an offensive core. Great! In the absence of Urias and Mitchell, who had stormed the MLB scene in an arguably surprising way compared to his advanced minor league scouting reports, no one else is stepping up. The club got Tyrone Taylor back, and he's not producing; Adames went ice cold after a nice start; and the Jesse Winker gamble looks ill-conceived (last year's ugly slugging percentage even looks preferable by comparison). Rowdy Rowdy Tellez is holding steady, and his production would be a nice depth option on a club where more of the expected producers actually produced. So, here you have the Brewers offense. A few bad trades by management, leaning on player development that has not produced an impact position player in quite a while, bad timing with numerous simultaneous injuries, and a couple important veteran core bats going cold, and Brewers fans are being treated to an offense that not only looks bad, but does not appear to have many paths forward to good production.
 -
 It must be interesting to be a Tampa Bay Rays fan. Their payrolls certainly are not as robust as their recent list of feats and playoff appearances, as even the Brewers have outspent the Rays by more than $40 million total in the last two years. Milwaukee cut payroll by $14 million entering 2023, and still figure to outspend the Rays by more than $10 million. Do the Rays need to spend, though? They are the Twitter egg saying "well actually, you don't need to spend to win" personified as an MLB club. What's interesting about the Brewers and Rays is that both clubs have come to prominence in similar ways over the last 15 years, snapping gruesome streaks in 2008. Tampa Bay, of course, was the dreadful expansion club that leapt from worst to first with the 2008 World Series runner-up, thanks (in part) to a surge onto the scene by lefty David Price, while Milwaukee snapped their generation-long playoff drought with their own legendary southpaw performance. From 2008 onward, the small-market clubs are exemplars of winning and not tanking within MLB, although the Rays certainly raise more eyebrows with their payrolls. 2008-present Rays: 1,267 wins entering 2023, with eight 90+ win seasons and one -70 win season, resulting in eight playoff seasons ($1.1 billion payroll, 2012-present). Their best playoff achievement was two American League pennants (2008, 2020). 2008-present Brewers: 1,204 wins entering 2023, with four 90+ win seasons and one -70 win season, resulting in six playoff seasons ($1.3 billion payroll, 2012-present). Their best playoff achievement was two National League Championship series appearances (2011, 2018). One of my closest friends always used to opine with me about how baseball is essentially about failure. I thought of that the other night, watching Brian Anderson and Joey Wiemer absolutely crush some mistakes. These guys spend years of their adult lives working to hone their respective crafts, day in and day out, grinding 0-for-4 days and demotions and trades to simply be ready to crush their mistake when they see it. Baseball is a beautiful pastime because it is about routine and repetition, and at its best, it is about how excellence can burst forth from routine and repetition. From a 30,000-foot view, the success of the Rays over the last 15 years might seem less pronounced. When considering win total; would you have guessed that their exceptional small-market franchise has only won 63 more games than the Brewers over this long span? The shape of those wins, however, the distribution of those wins, appears more severe when you look at playoff appearances, and playoff success. Neither team won a title over the last 15 seasons. Was it all failure? Half the time, the Rays put forward a 90-win club. The Brewers reached the playoffs once every three years on average, and they made the League Championship Series twice in a decade. That's better than their expected odds, if you assume a smooth distribution of playoff appearances throughout the entire league. But leagues are actually uneven, of course; the Rays need to craft their success within the brutal competitive environs of the American League East, while the Brewers have been able to hang out in the less daunting National League Central. The Brewers spent $1.08 million on each of their wins over the last fifteen years. The Rays didn't even spent $870,000 per win. How do they do it? Expected Records Tampa Bay Rays (33-12 expected record): 277 runs scored / 156 runs allowed. +77 runs scored / +40 runs allowed. 118 to 120 expected win pace. Milwaukee Brewers (22-21 expected record): 183 runs scored / 182 runs allowed. -6 runs scored / +7 runs allowed. 81 to 83 expected win pace. How do you build a 120-win core? I looked at this question because it's the most interesting possible aspect of this series I could cover, besides the general look at how both of these small-market clubs have operated over the last 15 years. If you follow publications like Baseball Prospectus, the Rays have been known as a darling MLB player-development system for quite a while. For example, the Brewers had their very best system in recent memory entering 2023, and the BP staff covered 16 prospects; in 2022 the Brewers had 17 prospects covered; and in 2021, only 12 prospects covered. The Rays list was capped at 20 prospects covered in 2023; 20 prospects covered in 2022; and entering 2021, maybe to win a bet, BP covered 27 Rays prospects. In 2021, current Rays ace Shane McClanahan was ranked the sixth-best prospect in their system. Luckily for the Brewers, just like the Rays, they graduated their top three 2021 prospects to their 2023 MLB club. Unfortunately for the Brewers, those prospects were not Wander Franco, Randy Arozarena, and Shane Baz (although I guess the third slot for both clubs, Aaron Ashby and Baz, were doomed for 2023 to begin with, due to injuries). Entering 2021, Baseball Prospectus identified eight Role 55 prospects outside of the top 10 for Tampa, plus another four prospects with the "throw a dart" moniker. By comparison, the 2021 Brewers system had four Role 55 prospects total. (Overall Future Potential Roles typically span a 20 to 80 scale, where a Role 50 prospect is projected to be an MLB average role player. For reference, Mario Feliciano, Tristen Lutz, and Antoine Kelly were potential Role 50 prospects in 2021, with varying levels of risk assigned to that grade). So, the following list is frustrating. But it's a look at the top-performing Rays batters (their entire starting lineup is batting with an OPS that is better than league average) and their biggest bulk inning pitchers. What is perhaps most impressive about this Rays club is that they are achieving so much success with a relatively high number of pitching injuries (Baseball Reference demonstrates that they currently have three 2023 contributors on the 60-day injured list, plus injured arms like Baz who have never hit the MLB mound this year). I highlighted "homegrown" players in bold to demonstrate that even in an elite player-development system like the Rays, a ton of talent enters the MLB club from outside the system. In fact, even the relatively weak (in terms of homegrown talent) Brewers club has nearly as many homegrown players on their 2023 roster as the Rays. Current homegrown starters and high-inning pitchers for the Brewers are Corbin Burnes, Peter Strzelecki, Tyrone Taylor, Brice Turang, Joey Wiemer, and Devin Williams. C Christian Bethancourt acquired via trade, July 2022 (depth trade) 1B Yandy Diaz acquired via 3-way trade (Carlos Santana / Edwin Encarnacion trade. Tampa Bay traded away Jake Bauers and cash, by the way) 2B Brandon Lowe was drafted by the Rays (3rd round, 2015). The Brewers drafted Cody Ponce ahead of Lowe 3B Isaac Paredes acquired via trade, April 2022 (Austin Meadows traded away) SS Wander Franco was signed by the Rays as an elite bonus amateur free agent ($3.8 million) LF Randy Arozarena acquired via trade, January 2020 (Rays traded away Matthew Liberatore, Edgardo Rodriguez, and 2020 supplemental second-round pick) CF Jose Siri acquired via 3-way trade in August 2022 (Trey Mancini deal). Tampa Bay traded away Jayden Murray and Seth Johnson. RF Josh Lowe was drafted by the Rays (1st round, 13th pick, 2016). The Brewers drafted Corey Ray ahead of Lowe. DH Harold Ramirez was acquired via trade, March 2022 (depth trade with the Cubs) LHP Shane McClanahan was drafted by the Rays (1st round, 31st pick, 2018). The Brewers drafted Brice Turang ahead of McClanahan. RHP Drew Rasmussen [currently injured] was acquired via trade, May 2021 (the Willy Adames deal!) RHP Zach Eflin was acquired via free agency entering the 2023 season RHP Jeffrey Springs [currently injured] was acquired via trade, February 2021 (depth trade with Red Sox) RHP Taj Bradley was drafted by the Rays (5th round, 2018). The Brewers drafted Aaron Ashby ahead of Bradley. LHP Josh Fleming was drafted by the Rays (5th round, 2017). The Brewers drafted Brendan Murphy ahead of Fleming. RHP Yonny Chirinos was acquired as an international amateur free agent ($10,000 bonus, 2012). RHP Kevin Kelly was purchased from the Colorado Rockies in December 2022. LHP Jalen Beeks was acquired via trade, July 2018 (Nathan Eovaldi trade) RHP Jason Adam was acquired via free agency entering 2022. The Gist For all the presumed bad vibes of the Brewers, they have a 6-4 record following their six-game losing streak as April turned to May. So I suppose you could say they are 6-10 in their last 16, but I'm trying to be positive here. The numbers say that the Rays should lap the Brewers, but Tampa Bay is on a 4-6 stretch of their own over their last 10. There's no better time for the Brewers to right ship for the month of May than to make a statement against a tough opponent.
 -
Junkball Blues: Checking in on the Brewers' Rotation (Yikes)
FranchiseInsider posted an article in Brewers
 I was hoping that hosting a regular series on the Brewers pitching staff would demonstrate the club's steady improvement over the season, and thankfully for us... there are 125 games remaining in the season, entering Friday's series. For now, I get to demonstrate that the rotation (outside of Freddy Peralta) is pretty much spinning wheels, or worse--including our hero Wade Miley, who was knocked upside the head with a regression club by the Dodgers on Wednesday. As a reminder from the first column: Since the inaugural Junkball Blues column, the core rotation (primary four starters) pitched 74 innings over 14 games started, producing seven runs below average (-7 Runs Prevented). This performance had us all chanting, "In Adrian We Trust" when the Brewers activated Adrian Houser from the injured list this week, and Houser did not disappoint, with a fine return to the mound against a tough opponent. The rotation periphery (at this point Houser and Colin Rea) has been much better than the core over the last couple of weeks, working 21.3 innings over four starts, at a level one run below average (-1 Runs Prevented). To be clear, a typical replacement-level depth starting pitcher could be as bad as 10 runs below average (or worse) over a full season, so Rea's performance has been just fine thus far. Let's take a look at Milwaukee's active rotation core a couple of weeks ago (THEN), versus today (NOW): Wade Miley: THEN: 6 runs prevented (3 GS / 18.0 IP) / NOW: 4 runs prevented (7 GS / 40.0 IP) Freddy Peralta: THEN: 2 runs prevented (3 GS / 17.0 IP) / NOW: 5 runs prevented (7 GS / 40.7 IP) Eric Lauer: THEN: 0 runs prevented (4 GS, 23.0 IP) / NOW: -6 runs prevented (7 GS / 34.3 IP) Corbin Burnes: THEN: -1 runs prevented (4 GS, 22.7 IP) / NOW: -1 runs prevented (7 GS / 39.7 IP) Meanwhile, the current periphery of the rotation looks like this: Colin Rea: THEN: -0 runs prevented (2 GS / 10.7 IP) / NOW: -1 runs prevented (5 GS / 27.3 IP) NEW ENTRY: Adrian Houser (1 GS / 4.7 IP / +0 runs prevented) NO CHANGE Brandon Woodruff: 4 runs prevented (2 GS / 11.3 IP) NO CHANGE Janson Junk: -3 runs prevented (1 GS / 4.7 IP) This rotation, as a group, worked more than 95 innings over their last 18 games started, at a level approximately eight runs below average. It's not a pretty rotation: luckily, for the season this rotation is basically average, but their current trend is downward. If you placed the most recent rotational performance on an average team for a full season and all else was held equal, this rotation would bring the club down to 74 wins. Where does the rotation go from here? It's easy to say that 125 games remaining with a six-starter rotation core gives each of these pitchers another 20 turns to right ship. It's easy to write this off as a 36-game blip (it's not even a quarter of the season yet!). It's easy to look at the history for Corbin Burnes and believe that he can come back, but right now, the Brewers' favorite arbitration target is posting the worst strikeout rate of his career (19.8%), coupled with one of the worst walk rates of his career (8.6%)--all the while allowing the most hard-hit balls since his disastrous 2019 campaign. But at least 2019 had the excuse of a developing pitcher; you don't want to see this type of trend from a guy who's good enough to rightfully complain about his paycheck. Eric Lauer has everything going the wrong way from 2022: strikeouts down, walks and home runs up, while allowing the hardest-hit balls of his MLB career (including more line drives, more fly balls, and fewer ground balls (YIKES!)). Brandon Woodruff still won't return from the injured list for a little while. It's easy to look at the injury bug and say that the club has been hit hard, but the club's boosters over the offseason touted trades like the Hunter Renfroe deal as improving an area of weakness (pitching rotation); that's not necessarily showing yet, outside of Colin Rea. If you raise the question of Aaron Ashby's performance in 2022 and question his ability to pitch in this rotation, the depth picture looks even worse. The Brewers have been a pitching machine over the last six seasons that we started calling the arms and defense a Runs Prevention Unit. That's still the case, overall, because of the exceptional Brewers bullpen. Milwaukee relievers are currently preventing runs at five times the rate of the starters, and (frankly) keeping the club afloat while the offense also struggles (70 runs scored over the last 18 games, which is around nine runs below average). Will Brewers fans stomach the growing pains of developing rookie bats at the MLB level without the strength of a pitching rotation that was supposed to make that Big Show development plan palatable?
 -
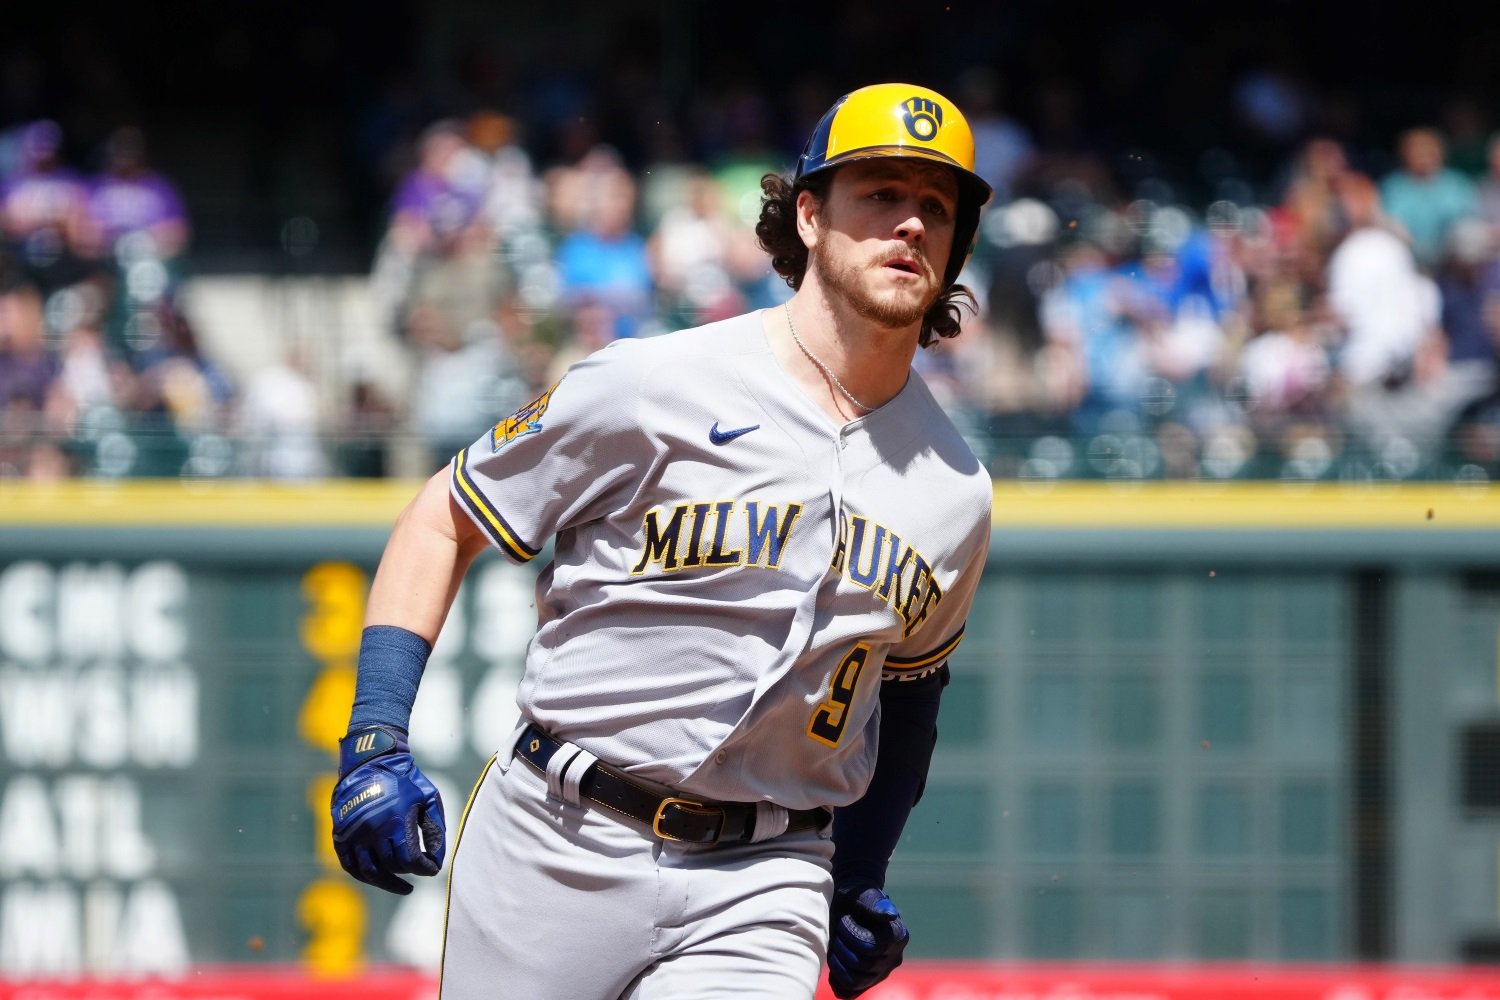 The Brewers have had a rough go of it lately. Entering Colorado, our beloved nine had lost two of three home series, on a homestand that was only redeemed by a visit from two of the greatest ballplayers ever to set foot in the Midwest (Shohei Ohtani and Mike Trout, of course). But according to the scoreboard, even the Brewers' own performance against the Los Angeles Angels was not great -- they managed 9 Runs Scored / 9 Runs Allowed against their West Coast foe. Surely, that's not a recipe for certain victory, and that performance mirrors the larger disappointments of the homestand (which went 33 Runs Scored / 40 Runs Allowed en route to a total of four wins in nine games). Throughout the season, I keep a daily tally of Milwaukee's "Pythagorean Win - Loss record," which is an estimation of the club's expected wins and losses based on Runs Scored and Runs Allowed. Why would anyone do this? Well, first and perhaps most importantly, Runs Scored and Runs Allowed are what they put on the scoreboard, and the balance of Runs Scored and Runs Allowed within one season have some suggestions about the true strength of a particular ballclub within that season (Baseball Reference has a nice brief discussion of the strengths and weaknesses of this). Even where its true statistical predictive qualities fail, following a club's underlying Runs Scored / Runs Allowed record over 162 games can maintain explanatory power, perhaps during short playoff series when seemingly improbable outcomes occur (remember, for instance, when the Toronto Blue Jays dismissed the supposedly superior Texas Rangers in the 2016 Playoffs? Or even when the seemingly inferior Los Angeles Dodgers ousted our beloved 2018 Brewers? [too soon?]). Secondly, by following a team throughout the 162 game season, it is possible to take the Pythagorean Win - Loss record even further by averaging it throughout an entire season. This allows us to understand the deviation between each team's true strengths and weaknesses. For instance, a 90-win club won't always play like a 90-win club. Remember our beloved 2018 Brewers, once again, who easily played half the season as a .500 or worse club? 2018 Brewers on May 30: 36 wins / 21 losses (on this date, the club just finished a series win against St. Louis) 2018 Brewers on August 30: 75 wins / 60 losses (on this date, the club just finished a series win at Cincinnati) I recall many Brewers fans ready to write this team off following relatively excruciating June, July, and August performances. In these months, the Brewers scored 362 runs, and allowed 370 runs, so they were truly about as bland as their record during those months showed. And then they rattled off #Craigtember, and all was forgiven. Hell, let's not forget that team had such an iconic run that Major League Baseball changed several rules because of their success (can't have small-market clubs using their full 40-man roster or so-called "openers" in the playoffs ). In almost every 96-win club, there is a .500 club for the bulk of the season, and you could say that about many losing clubs, too. Matthew Trueblood's series is truly aptly named: despite the long run of a 162 game season, whether a club is an elite winner or a cellar dweller truly does come down to the third set of 54 games in many cases. I don't believe it's a truism to suggest that on most MLB clubs, you could squint and see a 75-win club or an 85-win club, depending on how everything breaks and which assumptions you would make. So by averaging a club's daily win-loss and Runs Scored / Runs Allowed record, it is possible to catch trends relatively quickly and also understand the true strengths and weaknesses of a ballclub. For these reasons, roughly once a month this season I will write a brief summary of where the Brewers are in terms of their underlying record. May 4, 2023: 31 games complete Brewers Runs Scored: 137 Brewers Runs Allowed: 119 162 Game Pace Runs Scored versus National League and American Family Field: -5 (five runs below average). This means that if everything else was held equal, placing the Brewers current offense on an otherwise average club would produce an 80 win team. 162 Game Pace Runs Allowed versus National League and American Family Field: +93 (ninety-three runs better than average). This means that if everything else was held equal, placing the Brewers current defense and pitching staff on an otherwise average club would produce a 90 win team. Average Daily Win Loss Pace (Actual Wins): 94 wins (14 standard deviation, ex., between 80 and 108 wins) Average Daily Win Loss Pace (Pythagorean / Runs Scored vs. Runs Allowed): 107 wins (27 standard deviation, ex. between 80 and 134 wins) Immediate Trends: if the Brewers played the remainder of the season at the quality of their last 10 games, they would win approximately 67 games all season; if the Brewers played the remainder of the season at the quality of their last 20 games, they would have approximately 83 wins. Overall: the Brewers are currently averaging between 90 and 92 wins based on their total Runs Scored / Runs Allowed. Their daily average for the entire season is much higher due to the club's hot start (they spent nine of their first 14 games playing 120+ win baseball based on their Runs Scored / Runs Allowed). Their recent trends are much lower, due to a cold offense and injured rotation, which is suddenly exposing the strength of the club (its bullpen). By Element: Over 31 games, the Brewers offense has spent 15 games better than average, and 16 games below average. The pitchers have spent 20 games better than average, and 11 games below average. Thus far, on an average basis and a daily performance basis, the pitching / Runs Prevention Unit is leading the way for the club. The Gist: It's no secret: Adrian Houser, Aaron Ashby, and Brandon Woodruff are all injured for prolonged periods of time, and regardless of what you think about the quality of each of those pitchers, losing all three at once places immense stress on the bullpen and rotation. Indeed, if all of these arms were healthy, the Brewers would likely run out of rotation spots, resulting in Houser or Ashby filling a bullpen or swingman role. On top of this, Corbin Burnes has been average at best, and neither Eric Lauer nor Colin Rea have stepped up in their roles. Meanwhile, the offense is much worse than last season's club thus far, with only Rowdy Tellez, Brian Anderson, and William Contreras producing above-average OPS+ figures entering Thursday's series finale in Colorado. Thank goodness for the hot start, because recently the Brewers look like they are in trouble. Can rookies Brice Turang or Joey Wiemer seize starting roles with their bats? Will Christian Yelich or Jesse Winker snap out of their respective funks? This is a very good baseball team whose fortunes could go south very quickly; who's going to rise to the occasion and lead the club back to their next winning streak?
 -
The Brewers are hosting the Angels for the first time in seven years, almost to the day (Anaheim last visited Milwaukee May 1-4, 2016). This time, the Angels are bringing the greatest baseball player who has ever played in Milwaukee. Luckily he's a free agent after the season, so hopefully the Brewers are rolling out the red carpet this weekend... Image courtesy of © Gary A. Vasquez-USA TODAY Sports I don’t think we have any idea how good Shohei Ohtani is. The easiest historical comparison for elite two-way players is Babe Ruth, but even Ruth doesn’t hold a candle to Ohtani’s production combination. Rather, they each revolutionized the game: Ruth by demonstrating that the home run ball is not a sucker’s strategy at the plate, which arguably hastened the path to the modern game, and Ohtani by demonstrating that even within the hyper-specialized realm of contemporary Major League Baseball, a true two way player can not only succeed but break the game. It’s easy to think of Ruth as a two-way revolutionary himself, but I’m not entirely sure that’s the correct framing. Ruth worked the bulk of his impact pitching seasons between 1915 and 1919, with his best pitching seasons occurring in 1916 (323.7 IP, 158 ERA+) and 1917 (326.3 IP, 128 ERA+). Ruth also batted in 119 games over these two seasons, producing a 122 OPS+ in 1916 and a 162 OPS+ in 1917. By 1918 and 1919, Ruth was becoming a home run masher (hitting 11 and 29 long balls respectively) even prior to his fateful trade to the Yankees, but for these truly transcendent offensive seasons, his pitching workload dwindled and his production also fell closer to league average (102 ERA+ by 1919). After the trade to the Yankees, Ruth basically became a one-way player, pitching only a handful of innings. Ohtani worked through some injury issues and took a few years to build his batting approach in the MLB, emerging as a true two-way threat in 2021 and 2022. Here, we see a player that transcends even Ruth’s best two-way seasons. In 2021 and 2022, Ohtani worked 23 and 28 starts respectively, and improved from a 141 to a 174 ERA+--marking a jump from top-shelf number-two starter to true ace. Meanwhile, he batted full seasons in both years (155 and 157 games, with more than 630 plate appearances both years). At the plate, Ohtani was also far better than average, producing OPS+ metrics of 157 and 143 during these years. Sports Illustrated noted that these workloads in 2022 were enough for Ohtani to qualify for both pitching and hitting leaderboards in the same season, which had previously never happened. Not even Ruth ever worked enough as a two-way player to qualify for both leaderboards. Ruth edges Ohtani slightly in the OPS+ department, but what I want to demonstrate is the importance of sequential production. In 1916 and 1917, Ruth alternated better-than-average and exceptional production in each category, with batting production lagging in 1916 and pitching production lagging in 1917. He was never bad at either of his tasks, mind you, but he was never as consistent as Ohtani. We are comparing completely different games and eras, of course, but by contextualized stats like ERA+, Ohtani simply was the better pitcher, too. If you subscribe to the Wins Above Replacement (WAR) theory of baseball roster analysis, where players are assessed against the strength of the typical minor-league depth that would be called up in their absence, Ohtani’s numbers are pure comedy. I won’t even publish them because you won’t believe the numbers. If you think that players should be paid by production, Ohtani could be reasonably paid anywhere from $70 million to $140 million annually, when at his best. Not only do the Angels enjoy the luxury of elite pitching and batting production, the type that could lead the league in both categories, but they also get the privilege of consolidating this production in one roster spot. In a game where pitching tasks are becoming ever more specialized and having more relievers is advantageous, this gives the Angels the chance to eke out a few more wins annually by having an extra roster space for a pitcher. This surplus spot is probably worth anywhere from $5 million to $30 million, depending on whether the Angels are contending for a playoff spot (and therefore, wins are more lucrative). Even compared to a 10 WAR player, however great they may be, Ohtani offers a benefit as a 5x5 WAR player, because he's only taking one roster spot and equally splitting elite performance on both sides of the ball. The trouble with the team that *only* has, say, a 10 WAR bat is, well, they have to take yet another roster spot to find a counterpart on the other side of the diamond. Ruth’s revolution was one of approach, while Ohtani’s is one of roster usage and player development (can MLB clubs truly develop two-way impact players?). In this case, the Ruth revolution might remain more historically impactful, because it will be more difficult to achieve the Ohtani revolution, and we’re probably (at a minimum) a half-decade away from seeing if it works. Will MLB teams be able to replicate this two-way model to manipulate roster spots and gain true payroll value? At what point will teams settle for the benefits of even having near-league-average two-way baseball players sitting around the clubhouse, to preserve those roster spots? Expected Records Anaheim Angels (15-11 expected): 139 Runs Scored / 121 Runs Allowed, +14 Runs Scored / +4 Runs Allowed, 91 to 93 win pace. The Angels followed a rough road trip against the Red Sox and Yankees with home cooking and series against the Royals and Athletics. That's a wild and uneven way to go 7-7 over your last 14. Milwaukee Brewers (16-9 expected): 119 Runs Scored / 91 Runs Allowed, +9 Runs Scored / +17 Runs Allowed, 99 to 101 win pace. The Brewers had a rough week: they have thus far gone 2-4 against the Red Sox and Tigers (24 RS / 31 RA, that's true 2-4 baseball for the week and the quality of 62-win baseball for an entire season). Most Prominent Bats Anaheim Angels: Entering Thursday's win against Oakland, the Angels' top bats were Taylor Ward (111 PA, .221 / .324 / .337, 85 OPS+), Mike Trout (106 PA, .311 / .415 / .578, 173 OPS+), Shohei Ohtani (106 PA, .261 / .330 / .489, 124 OPS+), and Hunter Renfroe (104 PA, .280 / .356 / .581, 155 OPS+). Nope, no spot on the Brewers for another outfield bat. Milwaukee Brewers: It's still Christian Yelich / Willy Adames / Brian Anderson / Rowdy Tellez as the top four bats in terms of plate appearances for the Brewers, but this time the order has changed. Since the last preview, Yelich was knocked out of the top spot for Brewers playing time, and his OPS+ remains steadily below average (88 OPS+ after Wednesday's win against Detroit). Baseball Prospectus's Deserved Runs Created Plus (DRC+), a batting statistic that estimates a player's expected contribution based on contextual data, agrees that Yelich is truly below-average, with an 88 DRC+ and +/- 19 standard deviation (this early in the season, the error bars are going to be a bit wider). Even so, that suggests that underlying data mean Yelich would be expected produce a 69 DRC+ to 107 DRC+ range, meaning that his batting production could be as good as seven percent better than average, but as bad as 30 percent below average. In other words, thus far it's more probable that Yelich would be expected to produce below-average at the plate, and the trade off for his best possible outcomes is production 5 to 10 percent better than average. After the top bats, Joey Wiemer has an incredible, ready-to-go, high-level fourth-outfielder profile, and I love it. His plate discipline profile (a non-disqualifying rate of strikeouts mixed with a great blend of walks), power profile (seven extra-base hits in 84 plate appearances), speed profile (three stolen bases on four attempts), and defensive acumen (he can play all three outfield positions without notable issues) thus far make him look like the perfect depth player for a contending outfield. Ideally, he'd be the next person up off the Brewers bench, rotating outfield starts to provide days off, and providing extended starts when a primary outfielder is injured. I already thought that Tyrone Taylor had the perfect role for his skillset, but Wiemer looks like an even better "true impact depth outfielder." I am excited to see how he can push his forthcoming hot streak. Top Four Pitchers Anaheim Angels: Shohei Ohtani (6 GS, 34.0 IP, 7 R); Patrick Sandoval (5 GS, 25.7 IP, 12 R); Reid Detmers (4 GS, 21.7 IP, 12 R); Tyler Anderson (4 GS, 20.0 IP, 17 R). Milwaukee Brewers: Freddy Peralta (5 GS, 28.7 IP, 12 R); Corbin Burnes (5 GS, 27.7 IP, 15 R); Eric Lauer (5 GS, 26.0 IP, 15 R); Wade Miley (4 GS, 23.0 IP, 5 R). If you're wondering why the Brewers have had such a rough homestand thus far, since last week's preview, Milwaukee's four top arms worked a total of 24.7 innings and allowed 15 runs. Over the span of 162 games, this pitching performance would take a .500 club down to approximately 71 wins. Top Four Relievers Anaheim Angels: Tucker Davidson (6 G, 1 SV, 15.0 IP, 4 R); Jaime Barria (7 G, 13.3 IP, 7 R); there are arguably two closers (two relievers with four saves each), the better one is Carlos Estevez (11 G, 11.7 IP, 3 R). Milwaukee Brewers: Bryse Wilson (8 G, 2 SV, 16.0 IP, 3 R); Peter Strzelecki (12 G, 11.7 IP, 1 R); closer is Devin Williams (8 G, 8.0 IP, 0 R). Even after a bad blow-up game against the Tigers, the Milwaukee bullpen remains on solid footing, outperforming the starting rotation by quite a bit. Not only are the Brewers relievers performing better relative to the starters based on National League stats, they are also 14 runs better than the average NL bullpen. If everything else was held equal, this bullpen alone would turn an 81 win club into a 90 win club. Let's hope this relatively anonymous, deep group can keep it up. The Gist I hope the Brewers win this series and sign Shohei Ohtani in the offseason--and the best part is there's no excuse not to do either. View full article
-
Series Preview: Angels at Brewers - Shohei Ohtani in Town
FranchiseInsider posted an article in Brewers
 I don’t think we have any idea how good Shohei Ohtani is. The easiest historical comparison for elite two-way players is Babe Ruth, but even Ruth doesn’t hold a candle to Ohtani’s production combination. Rather, they each revolutionized the game: Ruth by demonstrating that the home run ball is not a sucker’s strategy at the plate, which arguably hastened the path to the modern game, and Ohtani by demonstrating that even within the hyper-specialized realm of contemporary Major League Baseball, a true two way player can not only succeed but break the game. It’s easy to think of Ruth as a two-way revolutionary himself, but I’m not entirely sure that’s the correct framing. Ruth worked the bulk of his impact pitching seasons between 1915 and 1919, with his best pitching seasons occurring in 1916 (323.7 IP, 158 ERA+) and 1917 (326.3 IP, 128 ERA+). Ruth also batted in 119 games over these two seasons, producing a 122 OPS+ in 1916 and a 162 OPS+ in 1917. By 1918 and 1919, Ruth was becoming a home run masher (hitting 11 and 29 long balls respectively) even prior to his fateful trade to the Yankees, but for these truly transcendent offensive seasons, his pitching workload dwindled and his production also fell closer to league average (102 ERA+ by 1919). After the trade to the Yankees, Ruth basically became a one-way player, pitching only a handful of innings. Ohtani worked through some injury issues and took a few years to build his batting approach in the MLB, emerging as a true two-way threat in 2021 and 2022. Here, we see a player that transcends even Ruth’s best two-way seasons. In 2021 and 2022, Ohtani worked 23 and 28 starts respectively, and improved from a 141 to a 174 ERA+--marking a jump from top-shelf number-two starter to true ace. Meanwhile, he batted full seasons in both years (155 and 157 games, with more than 630 plate appearances both years). At the plate, Ohtani was also far better than average, producing OPS+ metrics of 157 and 143 during these years. Sports Illustrated noted that these workloads in 2022 were enough for Ohtani to qualify for both pitching and hitting leaderboards in the same season, which had previously never happened. Not even Ruth ever worked enough as a two-way player to qualify for both leaderboards. Ruth edges Ohtani slightly in the OPS+ department, but what I want to demonstrate is the importance of sequential production. In 1916 and 1917, Ruth alternated better-than-average and exceptional production in each category, with batting production lagging in 1916 and pitching production lagging in 1917. He was never bad at either of his tasks, mind you, but he was never as consistent as Ohtani. We are comparing completely different games and eras, of course, but by contextualized stats like ERA+, Ohtani simply was the better pitcher, too. If you subscribe to the Wins Above Replacement (WAR) theory of baseball roster analysis, where players are assessed against the strength of the typical minor-league depth that would be called up in their absence, Ohtani’s numbers are pure comedy. I won’t even publish them because you won’t believe the numbers. If you think that players should be paid by production, Ohtani could be reasonably paid anywhere from $70 million to $140 million annually, when at his best. Not only do the Angels enjoy the luxury of elite pitching and batting production, the type that could lead the league in both categories, but they also get the privilege of consolidating this production in one roster spot. In a game where pitching tasks are becoming ever more specialized and having more relievers is advantageous, this gives the Angels the chance to eke out a few more wins annually by having an extra roster space for a pitcher. This surplus spot is probably worth anywhere from $5 million to $30 million, depending on whether the Angels are contending for a playoff spot (and therefore, wins are more lucrative). Even compared to a 10 WAR player, however great they may be, Ohtani offers a benefit as a 5x5 WAR player, because he's only taking one roster spot and equally splitting elite performance on both sides of the ball. The trouble with the team that *only* has, say, a 10 WAR bat is, well, they have to take yet another roster spot to find a counterpart on the other side of the diamond. Ruth’s revolution was one of approach, while Ohtani’s is one of roster usage and player development (can MLB clubs truly develop two-way impact players?). In this case, the Ruth revolution might remain more historically impactful, because it will be more difficult to achieve the Ohtani revolution, and we’re probably (at a minimum) a half-decade away from seeing if it works. Will MLB teams be able to replicate this two-way model to manipulate roster spots and gain true payroll value? At what point will teams settle for the benefits of even having near-league-average two-way baseball players sitting around the clubhouse, to preserve those roster spots? Expected Records Anaheim Angels (15-11 expected): 139 Runs Scored / 121 Runs Allowed, +14 Runs Scored / +4 Runs Allowed, 91 to 93 win pace. The Angels followed a rough road trip against the Red Sox and Yankees with home cooking and series against the Royals and Athletics. That's a wild and uneven way to go 7-7 over your last 14. Milwaukee Brewers (16-9 expected): 119 Runs Scored / 91 Runs Allowed, +9 Runs Scored / +17 Runs Allowed, 99 to 101 win pace. The Brewers had a rough week: they have thus far gone 2-4 against the Red Sox and Tigers (24 RS / 31 RA, that's true 2-4 baseball for the week and the quality of 62-win baseball for an entire season). Most Prominent Bats Anaheim Angels: Entering Thursday's win against Oakland, the Angels' top bats were Taylor Ward (111 PA, .221 / .324 / .337, 85 OPS+), Mike Trout (106 PA, .311 / .415 / .578, 173 OPS+), Shohei Ohtani (106 PA, .261 / .330 / .489, 124 OPS+), and Hunter Renfroe (104 PA, .280 / .356 / .581, 155 OPS+). Nope, no spot on the Brewers for another outfield bat. Milwaukee Brewers: It's still Christian Yelich / Willy Adames / Brian Anderson / Rowdy Tellez as the top four bats in terms of plate appearances for the Brewers, but this time the order has changed. Since the last preview, Yelich was knocked out of the top spot for Brewers playing time, and his OPS+ remains steadily below average (88 OPS+ after Wednesday's win against Detroit). Baseball Prospectus's Deserved Runs Created Plus (DRC+), a batting statistic that estimates a player's expected contribution based on contextual data, agrees that Yelich is truly below-average, with an 88 DRC+ and +/- 19 standard deviation (this early in the season, the error bars are going to be a bit wider). Even so, that suggests that underlying data mean Yelich would be expected produce a 69 DRC+ to 107 DRC+ range, meaning that his batting production could be as good as seven percent better than average, but as bad as 30 percent below average. In other words, thus far it's more probable that Yelich would be expected to produce below-average at the plate, and the trade off for his best possible outcomes is production 5 to 10 percent better than average. After the top bats, Joey Wiemer has an incredible, ready-to-go, high-level fourth-outfielder profile, and I love it. His plate discipline profile (a non-disqualifying rate of strikeouts mixed with a great blend of walks), power profile (seven extra-base hits in 84 plate appearances), speed profile (three stolen bases on four attempts), and defensive acumen (he can play all three outfield positions without notable issues) thus far make him look like the perfect depth player for a contending outfield. Ideally, he'd be the next person up off the Brewers bench, rotating outfield starts to provide days off, and providing extended starts when a primary outfielder is injured. I already thought that Tyrone Taylor had the perfect role for his skillset, but Wiemer looks like an even better "true impact depth outfielder." I am excited to see how he can push his forthcoming hot streak. Top Four Pitchers Anaheim Angels: Shohei Ohtani (6 GS, 34.0 IP, 7 R); Patrick Sandoval (5 GS, 25.7 IP, 12 R); Reid Detmers (4 GS, 21.7 IP, 12 R); Tyler Anderson (4 GS, 20.0 IP, 17 R). Milwaukee Brewers: Freddy Peralta (5 GS, 28.7 IP, 12 R); Corbin Burnes (5 GS, 27.7 IP, 15 R); Eric Lauer (5 GS, 26.0 IP, 15 R); Wade Miley (4 GS, 23.0 IP, 5 R). If you're wondering why the Brewers have had such a rough homestand thus far, since last week's preview, Milwaukee's four top arms worked a total of 24.7 innings and allowed 15 runs. Over the span of 162 games, this pitching performance would take a .500 club down to approximately 71 wins. Top Four Relievers Anaheim Angels: Tucker Davidson (6 G, 1 SV, 15.0 IP, 4 R); Jaime Barria (7 G, 13.3 IP, 7 R); there are arguably two closers (two relievers with four saves each), the better one is Carlos Estevez (11 G, 11.7 IP, 3 R). Milwaukee Brewers: Bryse Wilson (8 G, 2 SV, 16.0 IP, 3 R); Peter Strzelecki (12 G, 11.7 IP, 1 R); closer is Devin Williams (8 G, 8.0 IP, 0 R). Even after a bad blow-up game against the Tigers, the Milwaukee bullpen remains on solid footing, outperforming the starting rotation by quite a bit. Not only are the Brewers relievers performing better relative to the starters based on National League stats, they are also 14 runs better than the average NL bullpen. If everything else was held equal, this bullpen alone would turn an 81 win club into a 90 win club. Let's hope this relatively anonymous, deep group can keep it up. The Gist I hope the Brewers win this series and sign Shohei Ohtani in the offseason--and the best part is there's no excuse not to do either.
 -
The Red Sox and Brewers both have had interesting decades, as two MLB teams who have not "tanked" or gone through a "scorched earth" rebuild to retool their respective rosters. The Red Sox have four last-place finishes and two World Series banners to show for it. The Brewers have stayed out of the NL Central cellar, but have only advanced as far as the League Championship Series. Now, the Brewers host the Red Sox for the first time since 2017. Image courtesy of © Steven Bisig-USA TODAY Sports What a decade the Boston Red Sox have had. While other MLB clubs are adhering to competitive models that purposefully accelerate boom and bust cycles, the Red Sox have seesawed between winning and losing seasons while seemingly trying to do just the opposite. The typical competitive cycle, according to the Astros, Cubs, and similarly ruthless teams, is to undergo several years of losing and low-cost MLB roster development in order to procure elite draft picks and build through the farm system. Both the Brewers and the Red Sox buck this model. The Brewers, under previous president David Stearns, eschewed this roster strategy by using everything but the farm system to construct a series of competitive clubs. If you compare the Brewers' most competitive rosters under Stearns to the remainder of MLB, he relied on trades and free agency to a much greater extent than minor-league development (via the draft and international amateur signings). It is somewhat ironic that, through his tenure, he took time to slowly build an offensive prospect development system, In his parting gift, the 2023 Brewers offense now has three homegrown prospects (Garrett Mitchell, Brice Turang, and Joey Wiemer) and two more waiting nearby (Jackson Chourio, Sal Frelick). The Red Sox exhibited a seesaw development and roster construction pattern following their 2013 World Series victory, going from first to worst to worst to first within a four year period, setting up yet another World Series victory in 2018. After another quick downturn, the Red Sox visited the League Championship series in 2021, and then were rewarded with a last place finish in a hyper-competitive American League East in 2022 (they finished in fifth place with 78 wins!). Of course, unlike the Brewers, the Red Sox are a major media market behemoth, and have become somewhat notorious for trading away Mookie Betts and allowing Xander Bogaerts to walk. Of course, those contrarians who swore they liked the Betts trade for Boston might look smart in 2023, as Alex Verdugo's early season offensive surge makes it look like the post-hype prospect is putting it together at the MLB level. Repeat after me: Baseball player development is rarely linear, and often exhibits long, winding paths. For all this lack of tanks and rebuilding, the Red Sox are on a developmental upswing, ranked 23rd by Baseball Prospectus organizational prospect rankings in 2022, and 11th entering the 2023 season on the strength of their hitting prospects. Brewers fans will see the Red Sox second-best prospect (according to Baseball Prospectus) in Tristan Casas, who is looking for a true power breakout to reach his ceiling as a slugging first baseman. In this regard, the Brewers and Red Sox are quite similar, as Milwaukee's farm climbed from 19th to 14th on the strength of Chourio's development and the proximity of Frelick, Mitchell, Turang, and Wiemer to the MLB. All this is to say, if this series feels like the meeting of two "weird" clubs, it absolutely is. It's not hard to squint and see core players from the 2021 League Championship Series Red Sox on the 2023 club, including Verdugo, Rafael Devers, Enrique Hernandez, and Christian Arroyo in the field, plus Tanner Houck, Chris Sale, Nick Pivetta, and Garrett Whitlock in prominent pitching roles. Unlike the Brewers, who are playing in a relatively easy division, the Red Sox must be hungry to improve on their 2022 campaign and prepare themselves for the ridiculous gauntlet that is the American League East. They might be the worst club in the East, but they could be close to the best club in the National League Central. Life is hard. Expected Records Boston Red Sox (10-10 expected): 111 Runs Scored / 108 Runs Allowed. +10 Runs Scored / -8 Runs Allowed. 83 to 84 win pace. Milwaukee Brewers (13-6 expected): 95 Runs Scored / 60 Runs Allowed. +11 Runs Scored / +23 Runs Allowed. 110 to 113 win pace. The Red Sox enter the series on a strong streak, having won three of four games against the Angels and a series victory against the Twins at home. In their last seven games, they have scored 40 runs against 35 runs allowed. This puts the Red Sox much closer to a 90-win pace than their overall season record demonstrates. Usually, 10-game west coast trips are the stuff of nightmares, but the Brewers finished their recent swing with seven wins (!!!). In their absurd sweep of the Mariners, the Brewers scored 18 runs against 11 runs allowed. Most Prominent Bats (70+ Plate Appearances) Boston Red Sox: Justin Turner (87 PA, .257 / .356 / .351, 96 OPS+); Alex Verdugo (86 PA, .338 / .407 / .481, 144 OPS+); Rafael Devers (83 PA, .269 / .313 / .615, 148 OPS+); Enrique Hernandez (80 PA, .229 / .313 / .400, 95 OPS+) Milwaukee Brewers: Christian Yelich (87 PA, .234 / .322 / .377, 91 OPS+); Willy Adames (85 PA, .254 / .365 / .465, 126 OPS+); Brian Anderson (76 PA, .273 / .342 / .455, 116 OPS+); Rowdy Tellez (70 PA, .237 / .329 / .508, 126 OPS+) Raise your hand if you had Christian Yelich and Brian Anderson out-slugging Justin Turner to start the season... It's also interesting to note that, despite the call-up of three homegrown bats, the Brewers' absolute best and most relied-upon bats demonstrate the front office's strategy over the last few years: Yelich, Adames, and Tellez all acquired via trade, and Anderson a free agent. Notably, both Tellez and Adames are trade acquisitions made possible by blocked MLB paths with their former clubs, and/or change-of-scenery trades. Now, both appear to be flourishing in full-time MLB roles in Milwaukee. Top Four Pitchers Boston Red Sox: Tanner Houck (4 GS, 21 IP, 10 runs allowed); Kutter Crawford (4 G, 18.3 IP, 9 runs allowed); Chris Sale (4 GS, 18 IP, 17 runs allowed); Corey Kluber (4 GS, 18 IP, 17 runs allowed). No, those aren't type-o's for both Sale and Kluber... Milwaukee Brewers: Eric Lauer (4 GS, 23 IP, 11 runs allowed); Corbin Burnes (4 GS, 22.7 IP, 12 runs allowed); Wade Miley (3 GS, 18 IP, 3 runs allowed); Freddy Peralta (3 GS, 17 IP, 6 runs allowed). Top Relievers Boston Red Sox: Josh Winckowski (7 G, 14 IP, 3 runs allowed); Ryan Brasier (11 G, 11.3 IP, 11 runs allowed); closer is Kenley Jansen (6 G, 6 IP, 0 runs allowed) Milwaukee Brewers: Bryse Wilson (5 G, 11 IP, 2 saves, 2 runs allowed); Peter Strzelecki (9 G, 8.7 IP, 1 run allowed); closer is Devin Williams (6 G, 6 IP, 0 runs allowed) Two fun things to watch this series: (1) All will be well in the universe if the stars align for Peter Strzelecki to face Josh Winckowski during a high-leverage game in Milwaukee (2) Will this be the series that either (or both) of Devin Williams and Kenley Jansen allow their first runs? The Gist This series will be fun for a lot of reasons. First and foremost, there's little to no pressure on the Brewers following their exceptional road trip. There's really no danger in a series loss, as the road trip went better than anyone could have expected. But that makes this series a bit of a trap for the Brewers, as well; the Red Sox are playing better than their overall record shows. In a way, it's kind of a strength-versus-strength series, in terms of the Brewers pitching versus the Red Sox bats. The question is whether Milwaukee bats can take advantage of the uneven Red Sox pitching staff. View full article
-
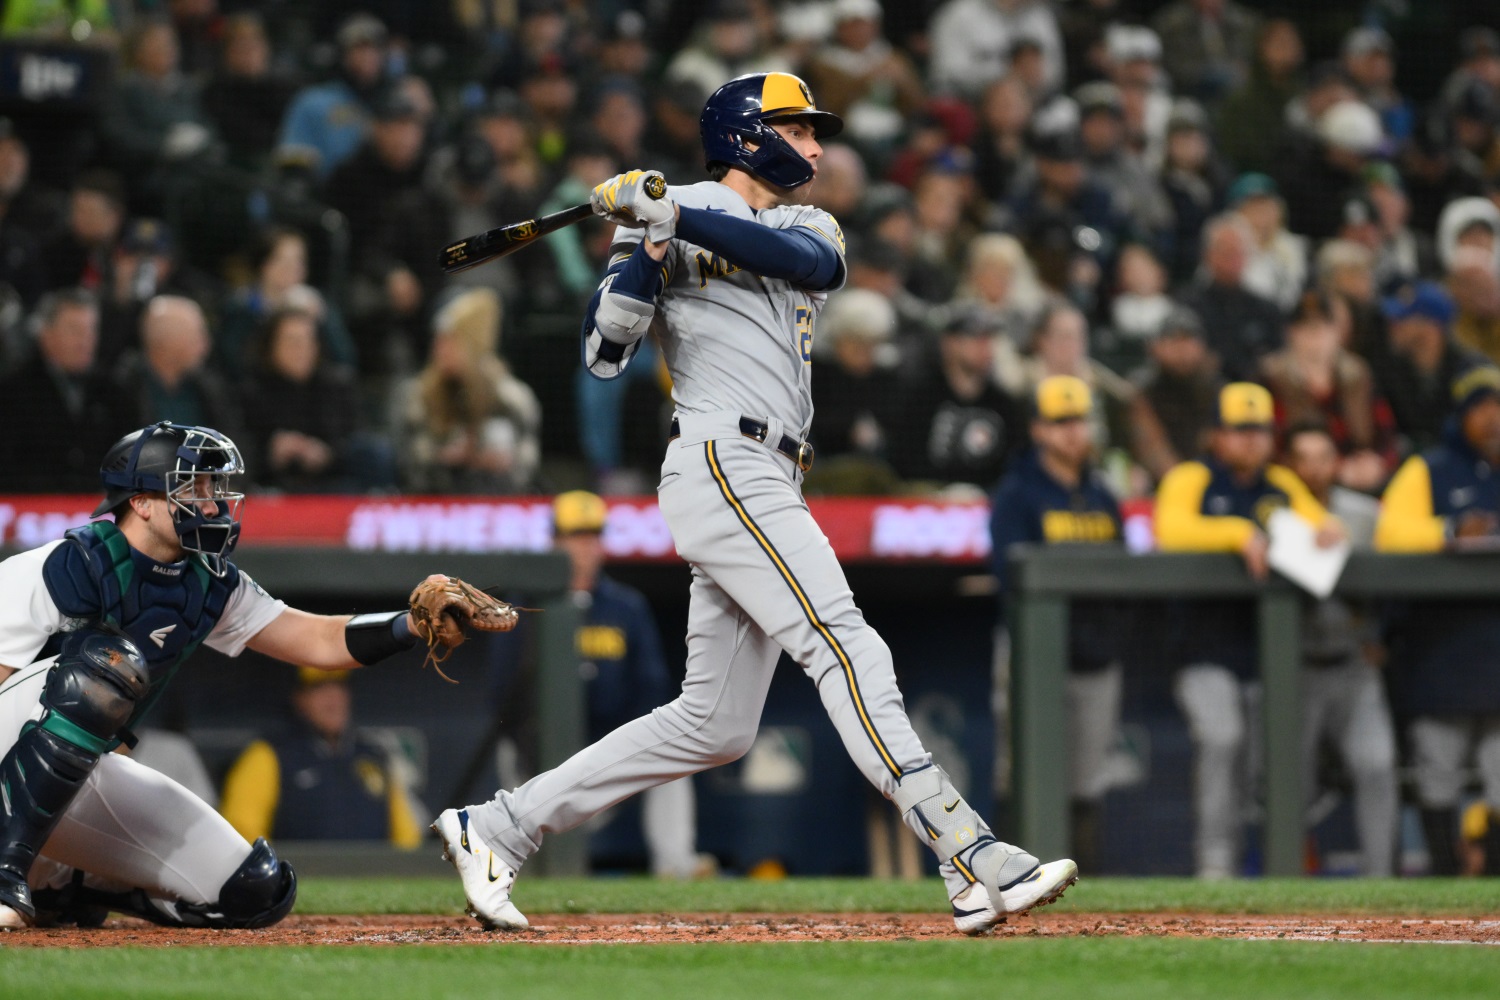 What a decade the Boston Red Sox have had. While other MLB clubs are adhering to competitive models that purposefully accelerate boom and bust cycles, the Red Sox have seesawed between winning and losing seasons while seemingly trying to do just the opposite. The typical competitive cycle, according to the Astros, Cubs, and similarly ruthless teams, is to undergo several years of losing and low-cost MLB roster development in order to procure elite draft picks and build through the farm system. Both the Brewers and the Red Sox buck this model. The Brewers, under previous president David Stearns, eschewed this roster strategy by using everything but the farm system to construct a series of competitive clubs. If you compare the Brewers' most competitive rosters under Stearns to the remainder of MLB, he relied on trades and free agency to a much greater extent than minor-league development (via the draft and international amateur signings). It is somewhat ironic that, through his tenure, he took time to slowly build an offensive prospect development system, In his parting gift, the 2023 Brewers offense now has three homegrown prospects (Garrett Mitchell, Brice Turang, and Joey Wiemer) and two more waiting nearby (Jackson Chourio, Sal Frelick). The Red Sox exhibited a seesaw development and roster construction pattern following their 2013 World Series victory, going from first to worst to worst to first within a four year period, setting up yet another World Series victory in 2018. After another quick downturn, the Red Sox visited the League Championship series in 2021, and then were rewarded with a last place finish in a hyper-competitive American League East in 2022 (they finished in fifth place with 78 wins!). Of course, unlike the Brewers, the Red Sox are a major media market behemoth, and have become somewhat notorious for trading away Mookie Betts and allowing Xander Bogaerts to walk. Of course, those contrarians who swore they liked the Betts trade for Boston might look smart in 2023, as Alex Verdugo's early season offensive surge makes it look like the post-hype prospect is putting it together at the MLB level. Repeat after me: Baseball player development is rarely linear, and often exhibits long, winding paths. For all this lack of tanks and rebuilding, the Red Sox are on a developmental upswing, ranked 23rd by Baseball Prospectus organizational prospect rankings in 2022, and 11th entering the 2023 season on the strength of their hitting prospects. Brewers fans will see the Red Sox second-best prospect (according to Baseball Prospectus) in Tristan Casas, who is looking for a true power breakout to reach his ceiling as a slugging first baseman. In this regard, the Brewers and Red Sox are quite similar, as Milwaukee's farm climbed from 19th to 14th on the strength of Chourio's development and the proximity of Frelick, Mitchell, Turang, and Wiemer to the MLB. All this is to say, if this series feels like the meeting of two "weird" clubs, it absolutely is. It's not hard to squint and see core players from the 2021 League Championship Series Red Sox on the 2023 club, including Verdugo, Rafael Devers, Enrique Hernandez, and Christian Arroyo in the field, plus Tanner Houck, Chris Sale, Nick Pivetta, and Garrett Whitlock in prominent pitching roles. Unlike the Brewers, who are playing in a relatively easy division, the Red Sox must be hungry to improve on their 2022 campaign and prepare themselves for the ridiculous gauntlet that is the American League East. They might be the worst club in the East, but they could be close to the best club in the National League Central. Life is hard. Expected Records Boston Red Sox (10-10 expected): 111 Runs Scored / 108 Runs Allowed. +10 Runs Scored / -8 Runs Allowed. 83 to 84 win pace. Milwaukee Brewers (13-6 expected): 95 Runs Scored / 60 Runs Allowed. +11 Runs Scored / +23 Runs Allowed. 110 to 113 win pace. The Red Sox enter the series on a strong streak, having won three of four games against the Angels and a series victory against the Twins at home. In their last seven games, they have scored 40 runs against 35 runs allowed. This puts the Red Sox much closer to a 90-win pace than their overall season record demonstrates. Usually, 10-game west coast trips are the stuff of nightmares, but the Brewers finished their recent swing with seven wins (!!!). In their absurd sweep of the Mariners, the Brewers scored 18 runs against 11 runs allowed. Most Prominent Bats (70+ Plate Appearances) Boston Red Sox: Justin Turner (87 PA, .257 / .356 / .351, 96 OPS+); Alex Verdugo (86 PA, .338 / .407 / .481, 144 OPS+); Rafael Devers (83 PA, .269 / .313 / .615, 148 OPS+); Enrique Hernandez (80 PA, .229 / .313 / .400, 95 OPS+) Milwaukee Brewers: Christian Yelich (87 PA, .234 / .322 / .377, 91 OPS+); Willy Adames (85 PA, .254 / .365 / .465, 126 OPS+); Brian Anderson (76 PA, .273 / .342 / .455, 116 OPS+); Rowdy Tellez (70 PA, .237 / .329 / .508, 126 OPS+) Raise your hand if you had Christian Yelich and Brian Anderson out-slugging Justin Turner to start the season... It's also interesting to note that, despite the call-up of three homegrown bats, the Brewers' absolute best and most relied-upon bats demonstrate the front office's strategy over the last few years: Yelich, Adames, and Tellez all acquired via trade, and Anderson a free agent. Notably, both Tellez and Adames are trade acquisitions made possible by blocked MLB paths with their former clubs, and/or change-of-scenery trades. Now, both appear to be flourishing in full-time MLB roles in Milwaukee. Top Four Pitchers Boston Red Sox: Tanner Houck (4 GS, 21 IP, 10 runs allowed); Kutter Crawford (4 G, 18.3 IP, 9 runs allowed); Chris Sale (4 GS, 18 IP, 17 runs allowed); Corey Kluber (4 GS, 18 IP, 17 runs allowed). No, those aren't type-o's for both Sale and Kluber... Milwaukee Brewers: Eric Lauer (4 GS, 23 IP, 11 runs allowed); Corbin Burnes (4 GS, 22.7 IP, 12 runs allowed); Wade Miley (3 GS, 18 IP, 3 runs allowed); Freddy Peralta (3 GS, 17 IP, 6 runs allowed). Top Relievers Boston Red Sox: Josh Winckowski (7 G, 14 IP, 3 runs allowed); Ryan Brasier (11 G, 11.3 IP, 11 runs allowed); closer is Kenley Jansen (6 G, 6 IP, 0 runs allowed) Milwaukee Brewers: Bryse Wilson (5 G, 11 IP, 2 saves, 2 runs allowed); Peter Strzelecki (9 G, 8.7 IP, 1 run allowed); closer is Devin Williams (6 G, 6 IP, 0 runs allowed) Two fun things to watch this series: (1) All will be well in the universe if the stars align for Peter Strzelecki to face Josh Winckowski during a high-leverage game in Milwaukee (2) Will this be the series that either (or both) of Devin Williams and Kenley Jansen allow their first runs? The Gist This series will be fun for a lot of reasons. First and foremost, there's little to no pressure on the Brewers following their exceptional road trip. There's really no danger in a series loss, as the road trip went better than anyone could have expected. But that makes this series a bit of a trap for the Brewers, as well; the Red Sox are playing better than their overall record shows. In a way, it's kind of a strength-versus-strength series, in terms of the Brewers pitching versus the Red Sox bats. The question is whether Milwaukee bats can take advantage of the uneven Red Sox pitching staff.
 -
Brewers starting pitching took a step back in 2022, and even then, their seventh starting pitcher didn't log their first start until May 30. So if someone told you that by April 20, 2023, the Brewers would have already used seven starting pitchers; that three prospective starters would have spent time on the injured list; that Wade Miley would be the best starting pitcher on the club, how would you say the rotation was doing? Image courtesy of © Steven Bisig-USA TODAY Sports On Friday night, against the Boston Red Sox at American Family Field, Freddy Peralta will take the mound in his fourth turn through the rotation, following a West Coast road trip that almost could not have gone better. Thus far, the Brewers have been an extremely balanced team in terms of offense, pitching, and defense picking up one another. Right now, however, the surface stats suggest that the pitching is leading the way. At 95 Runs Scored and 60 Runs Allowed, the Brewers are on a "true" expected pace of 110 to 113 wins (using their Runs Scored / Runs Allowed), certainly enough to satisfy even the most cynical of Brewers fans (myself included!). Against the expected National League and home park environment, according to Baseball Reference multi-year park factors, the Brewers bats are a respectable 11 runs better than average after nineteen games. By contrast, the arms and defense are approximately 24 runs better than average. What is astonishing about this Brewers rotation is that Aaron Ashby, Adrian Houser, and now Brandon Woodruff are on the injured list for extended periods of time, and offseason depth acquisition Janson Junk has provided nothing more than an emergency start at this point. I say this is astonishing because last year, the Brewers starting rotation was the biggest weakness of the club, impacted by a few injuries and depth issues, as well as backward steps (some admittedly injury-induced) by Corbin Burnes, Woodruff, and Peralta. Given that set of circumstances, the fact that this team is tracking toward triple-digit victories is more than a pleasant surprise. So far, the Brewers have avoided a disaster scenario, and that's a truly great thing. So, I want to write a semi-regular column throughout the year taking snapshots of the starting pitching rotation exactly where they are. For these purposes, I will be using Runs Prevented, which is a statistic that simply estimates how much better (or worse) a pitcher is against their home park environment and league environment, based on innings pitched. While there are many reliable advanced pitching stats out there, like Baseball Prospectus's Deserved Run Average (DRA, and its indexed cousin DRA-) and Fielding Independent Pitching (FIP), I prefer to use Runs Prevented because it correlates to the numbers that are posted on the scoreboard. There are (and have been) many articles published on why a pitcher might fail to live up to (or exceed) their expected runs production, but at the end of the day, baseball is still decided by Runs Scored and Runs Allowed (although perhaps MLB has an appetite for that rule change, too). To be clear, one would reasonably expect stats like DRA- to be indicators of expected performance for pitchers in the future--even more so than mere Runs Allowed Per 9 Innings Pitched--but I believe it is still important to look at the actual runs allowed by each pitching staff in order to understand the true shape of how the league is performing and how each team is performing. So, entering Friday’s game, the Brewers' active rotation core has the following look: Wade Miley: 6 runs prevented (3 GS / 18.0 IP) Freddy Peralta: 2 runs prevented (3 GS / 17.0 IP) Eric Lauer: 0 runs prevented (4 GS, 23.0 IP) Corbin Burnes: -1 runs prevented (4 GS, 22.7 IP) Meanwhile, the current periphery of the rotation looks like this: Brandon Woodruff: 4 runs prevented (2 GS / 11.3 IP) Colin Rea: -0 runs prevented (2 GS / 10.7 IP) Janson Junk: -3 runs prevented (1 GS / 4.7 IP) It is indisputable, at this point in the season, that the bullpen is driving the pitching staff, with nearly twice as many runs prevented by relievers as by starters thus far. But the pitching group is formidable overall. This rotation core inserted into an average club would put that club on an 88- to 90-win pace, if all else was held equal. After the next set of 16 games, and the next three turns through the rotation, do you think this list will look similar? View full article
-
Junkball Blues: The First Rotation Check-In Via Runs Prevented
FranchiseInsider posted an article in Brewers
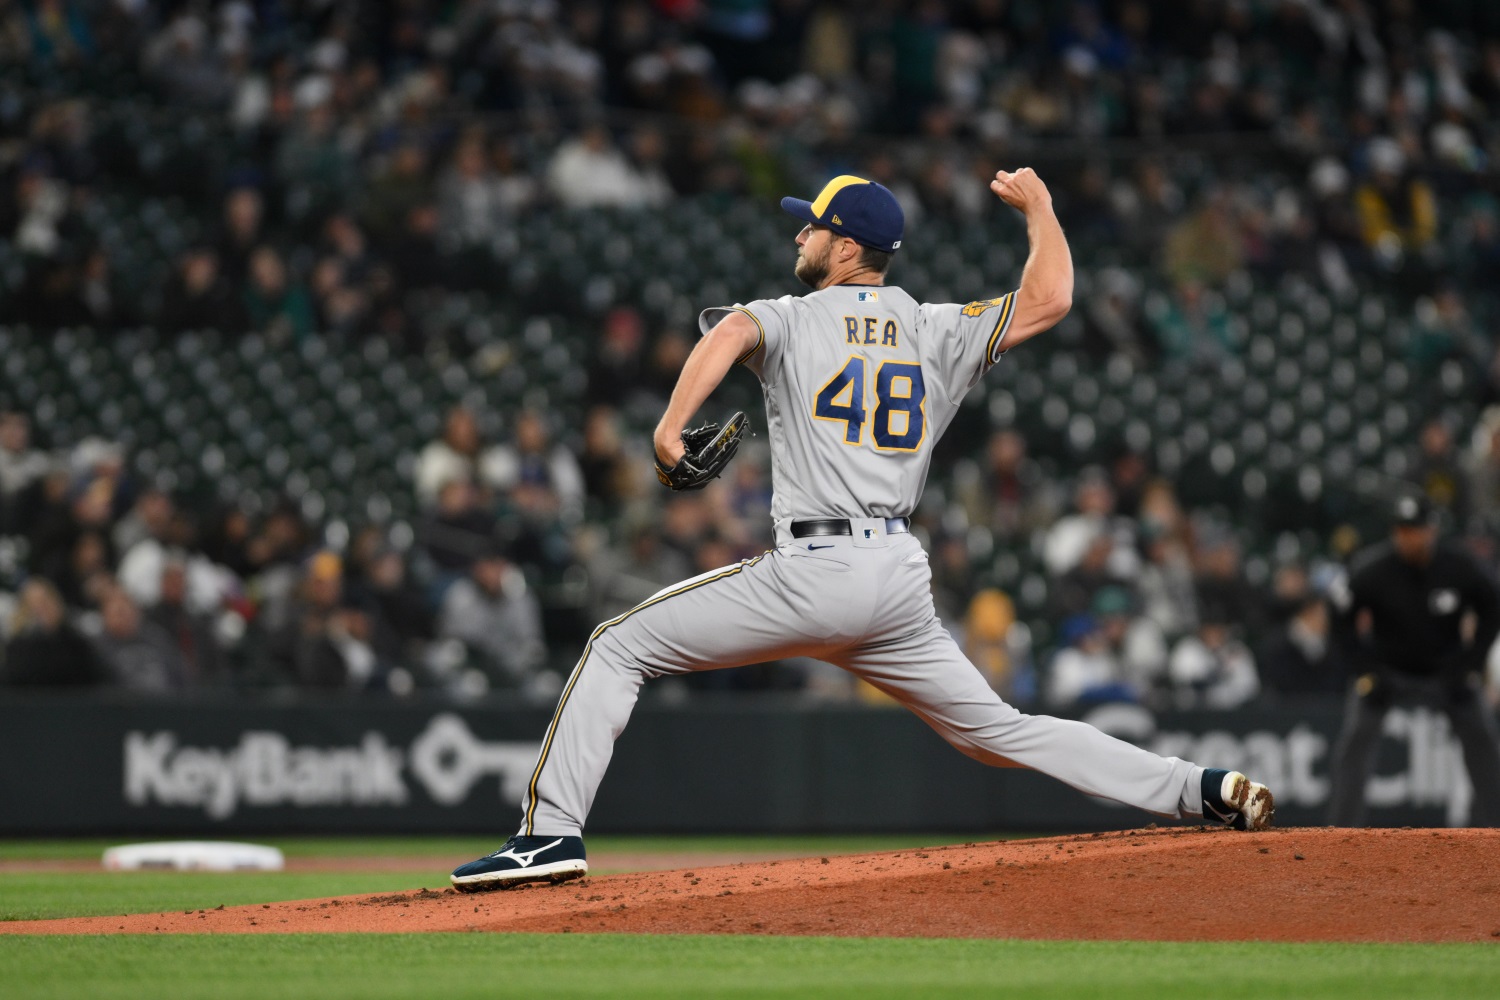 On Friday night, against the Boston Red Sox at American Family Field, Freddy Peralta will take the mound in his fourth turn through the rotation, following a West Coast road trip that almost could not have gone better. Thus far, the Brewers have been an extremely balanced team in terms of offense, pitching, and defense picking up one another. Right now, however, the surface stats suggest that the pitching is leading the way. At 95 Runs Scored and 60 Runs Allowed, the Brewers are on a "true" expected pace of 110 to 113 wins (using their Runs Scored / Runs Allowed), certainly enough to satisfy even the most cynical of Brewers fans (myself included!). Against the expected National League and home park environment, according to Baseball Reference multi-year park factors, the Brewers bats are a respectable 11 runs better than average after nineteen games. By contrast, the arms and defense are approximately 24 runs better than average. What is astonishing about this Brewers rotation is that Aaron Ashby, Adrian Houser, and now Brandon Woodruff are on the injured list for extended periods of time, and offseason depth acquisition Janson Junk has provided nothing more than an emergency start at this point. I say this is astonishing because last year, the Brewers starting rotation was the biggest weakness of the club, impacted by a few injuries and depth issues, as well as backward steps (some admittedly injury-induced) by Corbin Burnes, Woodruff, and Peralta. Given that set of circumstances, the fact that this team is tracking toward triple-digit victories is more than a pleasant surprise. So far, the Brewers have avoided a disaster scenario, and that's a truly great thing. So, I want to write a semi-regular column throughout the year taking snapshots of the starting pitching rotation exactly where they are. For these purposes, I will be using Runs Prevented, which is a statistic that simply estimates how much better (or worse) a pitcher is against their home park environment and league environment, based on innings pitched. While there are many reliable advanced pitching stats out there, like Baseball Prospectus's Deserved Run Average (DRA, and its indexed cousin DRA-) and Fielding Independent Pitching (FIP), I prefer to use Runs Prevented because it correlates to the numbers that are posted on the scoreboard. There are (and have been) many articles published on why a pitcher might fail to live up to (or exceed) their expected runs production, but at the end of the day, baseball is still decided by Runs Scored and Runs Allowed (although perhaps MLB has an appetite for that rule change, too). To be clear, one would reasonably expect stats like DRA- to be indicators of expected performance for pitchers in the future--even more so than mere Runs Allowed Per 9 Innings Pitched--but I believe it is still important to look at the actual runs allowed by each pitching staff in order to understand the true shape of how the league is performing and how each team is performing. So, entering Friday’s game, the Brewers' active rotation core has the following look: Wade Miley: 6 runs prevented (3 GS / 18.0 IP) Freddy Peralta: 2 runs prevented (3 GS / 17.0 IP) Eric Lauer: 0 runs prevented (4 GS, 23.0 IP) Corbin Burnes: -1 runs prevented (4 GS, 22.7 IP) Meanwhile, the current periphery of the rotation looks like this: Brandon Woodruff: 4 runs prevented (2 GS / 11.3 IP) Colin Rea: -0 runs prevented (2 GS / 10.7 IP) Janson Junk: -3 runs prevented (1 GS / 4.7 IP) It is indisputable, at this point in the season, that the bullpen is driving the pitching staff, with nearly twice as many runs prevented by relievers as by starters thus far. But the pitching group is formidable overall. This rotation core inserted into an average club would put that club on an 88- to 90-win pace, if all else was held equal. After the next set of 16 games, and the next three turns through the rotation, do you think this list will look similar?
 -
The Brewers tried to generate fanbase excitement by promoting their next potential core of prospects following the Hunter Renfroe trade, rather than spending additional payroll on a regular starting outfielder. Their early-season outfield rotations demonstrate that they still have room for more offensive firepower in the outfield. Image courtesy of © Orlando Ramirez-USA TODAY Sports If you're an everyday Milwaukee Brewers fan, it's no secret that Senior Vice President & General Manager Matt Arnold cut payroll in his first offseason leading the club. Cot's Baseball Contracts shows that while the Brewers finished 2022 with a 40-man Collective Bargaining Agreement (CBA) payroll around $153 million, the club entered 2023 with a 40-man CBA payroll around $139 million. There are arguably two major culprits that drove down the team's spending, depending on how you look at it; either the absence of Lorenzo Cain ($18 million contract slot) or Hunter Renfroe ($11.9 million arbitration victory against the Angels) in the outfield account for the bulk of the missing payroll. But there's good reason for Brewers fans to be excited, too. After the perceived failure or fan disappointment of top infield prospect Keston Hiura, the Brewers entered 2023 with the chance to simultaneously graduate a trio of highly-regarded outfield prospects: Garrett Mitchell (a consensus Top 100 prospect for Baseball America, Major League Baseball, and Baseball Prospectus); Joey Wiemer (a Top 50 prospect according to Baseball Prospectus); and Sal Frelick (a consensus Top 50 prospect according to these sites). This list also excludes lightning-fast riser Jackson Chourio, arguably in the top tier of the club's prospects in the last generation, whose future MLB path I will promptly stop writing about so as not to curse. It's easy to look at this relatively high-floor group of prospects, who give the Brewers loads of speed, great defense, and maybe even some chances at hit tool impact here or there, as reasonable insurance policies against losing Renfroe. Yet, it is possible to push against the club's strategy, to discern whether a contending club working on limited time with an elite pitching core properly allocated its payroll resources in the 2022-2023 offseason. The first issue is the matter of role expectations for each of these outfielders. If the Brewers truly believed that each of these outfielders (Chourio, Frelick, Mitchell, and Wiemer) have future starting roles, they arguably missed an opportunity by failing to sell high on at least one of thei four. So long as Christian Yelich remains with the club (and his contract spans at least six seasons including 2023), there's a logjam in the outfield: Yelich / Chourio / Frelick / Mitchell / Wiemer. The last two certainly look like they'd be overqualified as backups. The second issue is a matter of role attrition: according to Baseball Reference, in 2022, Major League Baseball clubs needed 395 outfield slots to complete the season. Baseball Reference shows that the median games started (GS) for MLB outfielders in 2022 was 20, and there were only 44 outfielders who started 100 or more games. The Brewers have plenty of space to develop their youngsters and maintain a roster spot for another impact bat on the MLB club, simply by virtue of the laws of attrition. The season-opening injury to Tyrone Taylor underscores this issue, prior to the Luis Urías injury making Brian Anderson the most important offseason acquisition for the club's roster depth. Thus far, the Manager Craig Counsell's own management of the roster demonstrates additional lost opportunity, and highlights the role that having an additional serviceable starting outfielder could bring to the club. The offense itself is starting out on solid ground, having scored 62 runs in 13 games entering Friday night's game in San Diego. This offensive output is already four runs better than the 2023 National League average, which means that (prorated to a full season of 162 games) this offense might turn an 81-win (.500 Winning Percentage) club into an 86-win club before pitching is even considered. Not bad! However, that production is mostly coming from places outside of the outfield, with the exception of Mitchell's hot start. Mitchell is opening the season with a .316/.366/.632 slash line, which is substantially better than both Yelich (.245/.339/.327) and Wiemer (.222/.333/.361) in this young season. The real issue demonstrated by injuries to Tyrone Taylor and Luis Urias to immediately start the season is that the club has no choice but to rely on Yelich's bat in the outfield. This is now an issue because Counsell is showing a willingness to start Wiemer at all three outfield slots. Presumably, on a club where more players were healthy, Yelich's bat would have more days off from left field. Instead, Yelich leads the outfield in games started (11 in left field), followed by Mitchell (9 in right field) and Wiemer (7 in right field, 3 in center field, and 1 in left field). It might be easy for the reader to suggest that injuries happen and should not be used as post hoc evidence for or against certain offseason moves, but I think the opposite argument could be easily made. The Brewers front office had the knowledge and awareness of the game's trends in terms of the number of outfielders needed to complete a season, and certainly the fragile injury balance that every MLB roster faces. There was no reason to enter the season expecting Taylor to serve as the primary right field option while awaiting all of these exciting prospects. Having an additional outfield bat on this club would not have blocked either Mitchell or Wiemer, especially given the flexibility Counsell has demonstrated with both players. View full article
-
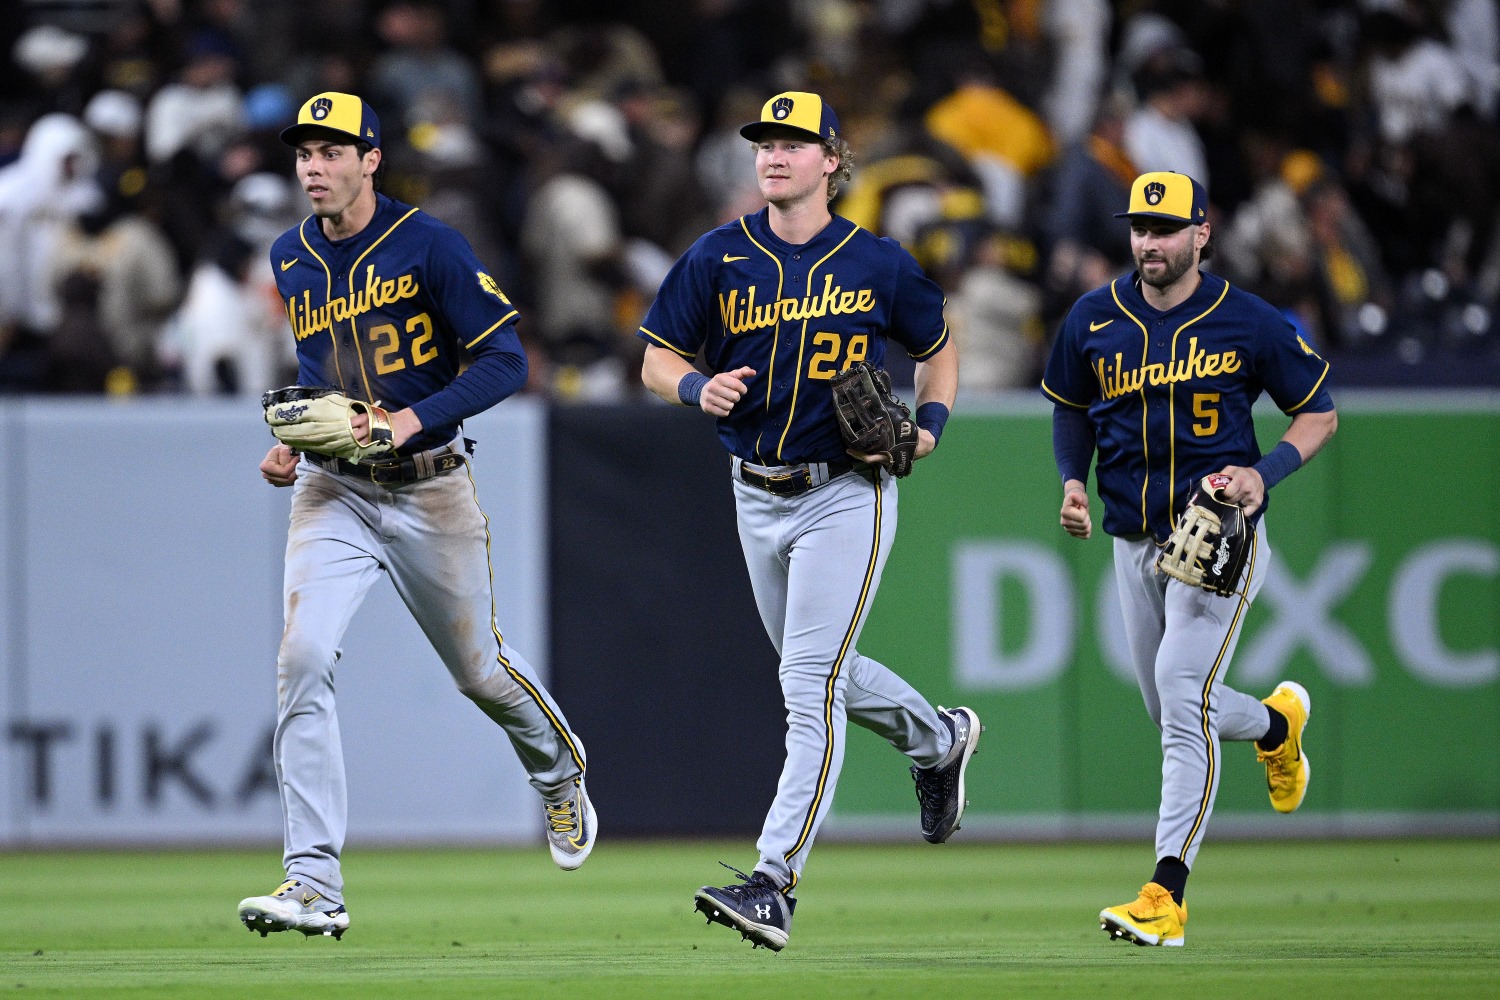 If you're an everyday Milwaukee Brewers fan, it's no secret that Senior Vice President & General Manager Matt Arnold cut payroll in his first offseason leading the club. Cot's Baseball Contracts shows that while the Brewers finished 2022 with a 40-man Collective Bargaining Agreement (CBA) payroll around $153 million, the club entered 2023 with a 40-man CBA payroll around $139 million. There are arguably two major culprits that drove down the team's spending, depending on how you look at it; either the absence of Lorenzo Cain ($18 million contract slot) or Hunter Renfroe ($11.9 million arbitration victory against the Angels) in the outfield account for the bulk of the missing payroll. But there's good reason for Brewers fans to be excited, too. After the perceived failure or fan disappointment of top infield prospect Keston Hiura, the Brewers entered 2023 with the chance to simultaneously graduate a trio of highly-regarded outfield prospects: Garrett Mitchell (a consensus Top 100 prospect for Baseball America, Major League Baseball, and Baseball Prospectus); Joey Wiemer (a Top 50 prospect according to Baseball Prospectus); and Sal Frelick (a consensus Top 50 prospect according to these sites). This list also excludes lightning-fast riser Jackson Chourio, arguably in the top tier of the club's prospects in the last generation, whose future MLB path I will promptly stop writing about so as not to curse. It's easy to look at this relatively high-floor group of prospects, who give the Brewers loads of speed, great defense, and maybe even some chances at hit tool impact here or there, as reasonable insurance policies against losing Renfroe. Yet, it is possible to push against the club's strategy, to discern whether a contending club working on limited time with an elite pitching core properly allocated its payroll resources in the 2022-2023 offseason. The first issue is the matter of role expectations for each of these outfielders. If the Brewers truly believed that each of these outfielders (Chourio, Frelick, Mitchell, and Wiemer) have future starting roles, they arguably missed an opportunity by failing to sell high on at least one of thei four. So long as Christian Yelich remains with the club (and his contract spans at least six seasons including 2023), there's a logjam in the outfield: Yelich / Chourio / Frelick / Mitchell / Wiemer. The last two certainly look like they'd be overqualified as backups. The second issue is a matter of role attrition: according to Baseball Reference, in 2022, Major League Baseball clubs needed 395 outfield slots to complete the season. Baseball Reference shows that the median games started (GS) for MLB outfielders in 2022 was 20, and there were only 44 outfielders who started 100 or more games. The Brewers have plenty of space to develop their youngsters and maintain a roster spot for another impact bat on the MLB club, simply by virtue of the laws of attrition. The season-opening injury to Tyrone Taylor underscores this issue, prior to the Luis Urías injury making Brian Anderson the most important offseason acquisition for the club's roster depth. Thus far, the Manager Craig Counsell's own management of the roster demonstrates additional lost opportunity, and highlights the role that having an additional serviceable starting outfielder could bring to the club. The offense itself is starting out on solid ground, having scored 62 runs in 13 games entering Friday night's game in San Diego. This offensive output is already four runs better than the 2023 National League average, which means that (prorated to a full season of 162 games) this offense might turn an 81-win (.500 Winning Percentage) club into an 86-win club before pitching is even considered. Not bad! However, that production is mostly coming from places outside of the outfield, with the exception of Mitchell's hot start. Mitchell is opening the season with a .316/.366/.632 slash line, which is substantially better than both Yelich (.245/.339/.327) and Wiemer (.222/.333/.361) in this young season. The real issue demonstrated by injuries to Tyrone Taylor and Luis Urias to immediately start the season is that the club has no choice but to rely on Yelich's bat in the outfield. This is now an issue because Counsell is showing a willingness to start Wiemer at all three outfield slots. Presumably, on a club where more players were healthy, Yelich's bat would have more days off from left field. Instead, Yelich leads the outfield in games started (11 in left field), followed by Mitchell (9 in right field) and Wiemer (7 in right field, 3 in center field, and 1 in left field). It might be easy for the reader to suggest that injuries happen and should not be used as post hoc evidence for or against certain offseason moves, but I think the opposite argument could be easily made. The Brewers front office had the knowledge and awareness of the game's trends in terms of the number of outfielders needed to complete a season, and certainly the fragile injury balance that every MLB roster faces. There was no reason to enter the season expecting Taylor to serve as the primary right field option while awaiting all of these exciting prospects. Having an additional outfield bat on this club would not have blocked either Mitchell or Wiemer, especially given the flexibility Counsell has demonstrated with both players.


