sveumrules
-
Posts
10,922 -
Joined
-
Last visited
-
Days Won
213
Content Type
Profiles
Forums
Blogs
Events
Milwaukee Brewers News, Rumors & Analysis
2026 Milwaukee Brewers Top Prospect Rankings
Milwaukee Brewers Videos
2022 Milwaukee Brewers Draft Picks & Signing Bonuses
Milwaukee Brewers Trade & Free Agent Rumors
Milwaukee Brewers Fan Guides & Resources
2023 Milwaukee Brewers Draft Picks & Signing Bonuses
2024 Milwaukee Brewers Draft Picks & Signing Bonuses
The Milwaukee Brewers Players Project
2025 Milwaukee Brewers Draft Picks & Signing Bonuses
2026 Milwaukee Brewers Draft Picks & Signing Bonuses
Store
Downloads
Gallery
Everything posted by sveumrules
-

Is Mark A positioning the Brewers for a sale?
sveumrules replied to True Blue Brew Crew's topic in Milwaukee Brewers Talk
Thank you for the impartial recap. Cubs opened up their wallet $65M wider than the Brewers this year, where’s it gonna get them? The Phillies have over double our payroll and haven’t won a game yet. Teams like the Angels, Rangers and Giants are spending around $60M to $90M more on payroll in hopes of just reaching the Brewers level. If your takeaway after a bunch of rookies and a reclamation project like Winker just rattled off three straight exciting wins is “durrr, Mark A cheap” you may be letting your economic biases take precedence over the actual baseball games. -
Looks like both Zach Vennaro and Harold Chirino saw velocity bumps this spring and were added to the Brewers board over at FanGraphs with these reports… “Another Indy Ball find for the Brewers, Vennaro was signed after pitching in the Can Am League, and it took extra time for his career to get off of the ground because of the pandemic. After toiling away in the mid-minors for a couple of years, Vennaro showed a nearly three-tick velo boost during the spring of 2023, his fastball moving from 93-95 mph into the 95-98 mph range. To call his delivery funky doesn't do it justice. If Adam Cimber's delivery is George Porter Jr., Vennaro's is Les Claypool. He gets deep into his rear leg and strides open as his arm swings with huge length all the way behind his body before he delivers from a sidearm slot. He's throwing 96 or so with huge tail and sink, and very little feel for location. Command issues and Vennaro's lack of a pitch to deal with opposite-handed hitters limits him to an up/down forecast, but he has uncommonly nasty stuff for that sort of role.” ”Chirino showed a velocity bump in the spring of 2023, working 94-97 with sink while mixing in a two-plane curveball in the 80-84 mph range. He looks like a quality up/down middle inning option.”
-
Mets (Carrasco) vs Brewers (Peralta): 04/03/23, 1:10pm
sveumrules replied to Brock Beauchamp's topic in Archived Game Threads
I’d guess most of the fans attending the game prefer the early start. Get to skip work, day drink on a Monday and then have more time to sleep it off before work tomorrow. -
Your 2023 Wisconsin Timber Rattlers
sveumrules replied to Jim Goulart's topic in Brewers Minor League Talk
245 SB vs only 34 CS the last two years. At a certain point a catcher needs to be able to throw people out. -
Giannis and Jokic are the two best players on the two best teams. Giving MVP to Embiid is a joke, really. Almost as bad as giving Smart DPOY last season. Finals MVP is all that matters now.
-
Give us your best tips on watching a game at AmFam
sveumrules replied to Brock Beauchamp's topic in Milwaukee Brewers Talk
Their ranking already fell off last season, though the raw per game numbers bounced back above where they were the last time the team was truly non-competitive. Full season ranks… 2016: 16th (28,6K) 2017: 10th (31.3K) 2018: 10th (35.2K) 2019: 7th (36.1K) 2021: 10th (22.5K) 2022: 14th (29.9K) A lot will depend on how the team is playing, last years timing was pretty much the worst possible because they had the best start in franchise history then fell apart starting right when attendance normally picks up after school lets out & the mediocrity continued through dealing Hader and the end of the season. If they are in the race and make a move to buy at the deadline this year they should have no problem getting back over 30K per game and closer to Top Ten range. Get off to a bad start, deal some combo of Burnes, Woody, Adames at the deadline would probably tank attendance back into the bottom half of the league. -
Both Carloses Rodriguezes on the same Shuckers squad…the singularity is upon us.
-
Hunter Renfroe catch yesterday
sveumrules replied to Brock Beauchamp's topic in Milwaukee Brewers Talk
That catch was insane. Ohtani had a ridiculous start too. Of course Angels pen blew it to the lowly A’s, with Esteury singling and coming around to score in the rally. -
Who gets the opening day nod? Junk? Gasser?
-
3 Takeaways from Brewers' Opening Day
sveumrules replied to Matthew Trueblood's topic in Brewer Fanatic Front Page News
You think they went home after the game with the off day today? Or is everyone sitting around in their hotel rooms with this weather? Then throw in what looks like another weather day that could cancel Saturday. Play a doubleheader Sunday if it clears, or just make it up later in the season? Just kind of weird vibes/no rhythm all around to start a season. If only there was a stadium with a roof like 69 miles north or whatever. -
Thought I’d start a thread to keep track of the various projection systems in one spot as the season goes on. After Brewers & Cardinals losses on Opening Day it looks like… BPro MIL: 86 W | 52% Div | 62% PO STL: 85 W | 39% Div | 53% PO 538 MIL: 86 W | 41% Div | 58% PO STL: 85 W | 38% Div | 55% PO FanGraphs STL: 87 W | 50% Div | 66.6% PO MIL: 85 W | 39% Div | 57% PO Rounded off the percentages but that FG playoff percentage for the Cardinals was a little too on the nose so I left it alone.
-
No, really. How long ago was 2015? It was "only" eight years ago, but what if I told you the two teams that met in the World Series that year entered the season with the 17th and 21st-ranked payrolls in MLB? Seems pretty inconceivable, eh? That would be like if the Twins & Diamondbacks met in the World Series this year. That'd be cool. Not as cool as the Brewers making it, but still better than the Yankees and Mets or whoever. Image courtesy of © Troy Taormina-USA TODAY Sports No, really. How long ago was 2015? It was "only" eight years ago, but what if I told you the two teams that met in the World Series that year entered the season with the 17th and 21st-ranked payrolls in MLB? Seems pretty inconceivable, eh? That would be like if the Twins & Diamondbacks met in the World Series this year. That'd be cool. Not as cool as the Brewers making it, but still better than the Yankees and Mets or whoever. We know there are all kinds of supposed truisms when it comes to making and, ideally, winning the World Series. You have to score the most runs, but you also have to allow the fewest runs. You definitely can't give up extra runs in the field. Outspending the competition surely doesn't hurt, either. Ultimately, your best bet is to do all of the aforementioned (& maybe even bang on some trash cans along the way). What I thought I'd do was go through the last ten full seasons of World Series match-ups to see what, if any, patterns could be gleaned. Below I've listed out those last ten full-season World Series entrants, with the winner at the top. Following in order, are their respective position player WAR, DRS, and runs allowed WAR (all via FanGraphs), plus their Opening Day Payroll via Cot's. MLB ranks for that season within each category are in parentheses. 2012 SFG: 29.0 WAR (3rd) | +11 DRS (11th) | 12.8 rWAR (18th) | $131M (6th) DET: 20.5 WAR (15th) | -29 DRS (24th) | 19.5 rWAR (10th) | $134M (5th) [This payroll match-up represents the second highest by combined rank in the sample, which is interesting because outside of the Giants position players, neither team got much bang for their buck beside the whole "making the World Series over a bunch of better regular season teams" thing.] 2013 BOS: 36.2 WAR (1st) | +22 DRS (11th) | 22.3 rWAR (6th) | $155M (4th) STL: 26.1 WAR (5th) | -38 DRS (22nd) | 18.1 rWAR (10th) | $117M (12th) [Cardinals with an uncharacteristically poor showing on defense, one of only four teams in the sample with a negative DRS. Spoiler Alert: they all lost their respective WS. Red Sox were the better team across the board, and not even Cardinal devil magic could prevail.] 2014 SFG: 25.4 WAR (6th) | +20 DRS (9th) | 10.8 rWAR (24th) | $149M (7th) KCR: 18.8 WAR (12th) | +27 DRS (8th) | 24.3 rWAR (3rd) | $92M (20th) [Royals with the lowest position player WAR in the sample versus Giants with the lowest rWAR in the sample. Ultimately Mad Bum going berserk was too much for Ned Yost's scrappy underdogs to overcome.] 2015 KCR: 21.8 WAR (9th) | +35 DRS (2nd) | 21.8 rWAR (4th) | $113M (17th) NYM: 24.6 WAR (6th) | -11 DRS (17th) | 18.1 rWAR (9th) | $101M (21st) [The titular bizarro 2015 Fall Classic. The Royals, somehow with a higher Opening Day payroll than the New York City Metropolitans, and with the aforementioned Ned Yost captaining the ship by batting Alcides Escobar lead off...you know what, it's so crazy it might just work.] 2016 CHC: 35.9 WAR (1st) | +107 DRS (1st) | 31.3 rWAR (1st) | $172M (6th) CLE: 24.0 WAR (6th) | +41 DRS (7th) | 21.0 rWAR (4th) | $96M (23rd) [Cleveland put together a shoestring juggernaut for one of only two teams in the sample with an OD payroll below $100M. Unfortunately, they ran into maybe the most juggernaut-iest team in the whole sample as the Cubs were the only entrant to rank first in all three position players WAR, DRS, and runs allowed WAR. It sounds like a dynasty in the making; sure, they'll show up some more in subsequent years.] 2017 HOU: 37.2 WAR (1st) | +21 DRS (14th) | 17.6 WAR (10th) | $124M (17th) LAD: 30.3 WAR (2nd) | +65 DRS (2nd) | 26.1 rWAR (5th) | $241M (1st) [Astros' first World Series winner was the last one with a bottom-half OD payroll and one of only two Fall Classic winners in the sample. It feels a little weird looking back on the most dominant team of the last six years as an underdog here, but the Dodgers had a more balanced squad, almost doubled them in OD payroll, and it ended up not mattering.] 2018 BOS: 32.3 WAR (2nd) | +10 DRS (15th) | 24.3 rWAR (3rd) | $234M (1st) LAD: 34.1 WAR (1st) | +55 DRS (5th) | 19.9 rWAR (9th) | $187M (3rd) [The highest match-up in the sample by OD payroll rank. But ultimately, as it was always ordained to be Mookie Betts, no wait Chris Sale, oops make that David Price, ok had to be JD Martinez, scratch that, Steve Pearce who toppled the mighty Dodgers and took home World Series MVP before returning to being Steve Pearce.] 2019 WAS: 28.2 WAR (5th) | +26 DRS (12th) | 21.1 rWAR (8th) | $197M (4th) HOU: 42.0 WAR (1st) | +97 DRS (2nd) | 31.3 rWAR (1st) | $158M (9th) [Astros had the highest position player WAR in the sample, the second highest DRS in the sample, and the second highest runs allowed WAR in the sample. Right there with the 2016 Cubs across the board, maybe even ahead of them when you add it all up. But Strasburg and a freshly twenty-one-year-old Juan Soto were too much for Houston to handle.] 2021 ATL: 24.0 WAR (8th) | +50 DRS (8th) | 22.4 rWAR (7th) | $131M (10th) HOU: 33.7 WAR (1st) | +76 DRS (3rd) | 23.5 rWAR (5th) | $188M (5th) [Once again, the Astros found themselves in the World Series with the better team, though the pitching was close. When the dust settled, Houston's collection of stars at the plate couldn't quite keep pace with World Series MVP Jorge Soler, who promptly returned to being Steve Pearce.] 2022 HOU: 29.5 WAR (6th) | +67 DRS (5th) | 33.0 rWAR (2nd) | $175M (10th) PHI: 21.6 WAR (11th) | -33 DRS (25th) | 18.0 rWAR (9th) | $229M (4th) [Despite having the third highest OD payroll in the sample by actual cash, the Phillies team is one of the more underwhelming entrants in the sample with the 3rd lowest position player WAR, 2nd worst DRS, and a bottom six pitching staff. Astros just keep biting that apple.] CATEGORY NOTES Position Player WAR: the WS team with higher position player WAR has gone 6-4 in the last ten full season World Series. The average winner has had 30.0 WAR and a 4th ranking; the average loser has 27.6 WAR and a 6th ranking. The last three #1 ranked teams in this category have lost the WS, the lowest to win were 2015 KCR (9th) and 2021 ATL (8th). Defensive Runs Saved: as noted earlier, the only four teams to make the Fall Classic with negative DRS lost. The overall theme is just coming out in the positive with a 5-5 record for teams with the better DRS. 2018 BOS at +10 DRS (15th) was the worst fielding team to win a WS in the sample. Runs Allowed WAR: another split at 5-5 for the team with the better rWAR, though the two San Francisco teams, skew the sample somewhat. Losing teams averaged 22.0 WAR and a 7th ranking; winning teams with SF included came in at 21.7 WAR and an 8th ranking. Remove their two outlier seasons, and it goes to a 5-3 record with 24.2 WAR and a 4th ranking for the other eight WS winners in the sample. Opening Day Payroll: the team with the higher OD payroll has gone 6-4 during the sample. Only three Fall Classics in the sample featured two top ten OD payrolls - 2012 (#6 vs. #5), 2018 (#1 vs. #3), and 2019 (#4 vs. #9). The last two World Series have featured payroll upsets, and only two #1 payrolls have even made the last ten Fall Classics, not good signs for Stevzie Cohen. At the same time, the Brewers currently clock in 20th in OD payroll with only three teams making the last ten Fall Classics with a payroll that low, and all three losing at that. These are not good signs for Brewers fans, either. Another possible trend to keep an eye on with regards to OD payroll from 2012-17 is the cumulative rank of WS participants was about 23; there were a lot more mid and small markets represented, with half the WS teams ranking 12th or lower. From 2018-22 that cumulative rank has been about 12 to 13, with only two teams (25%) ranking 10th or lower, though those same two teams also won the last two World Series, to remind us how random this whole enterprise truly is. What do you think? Is there anything we missed? Something in the numbers that jump out to your eyes? View full article
-
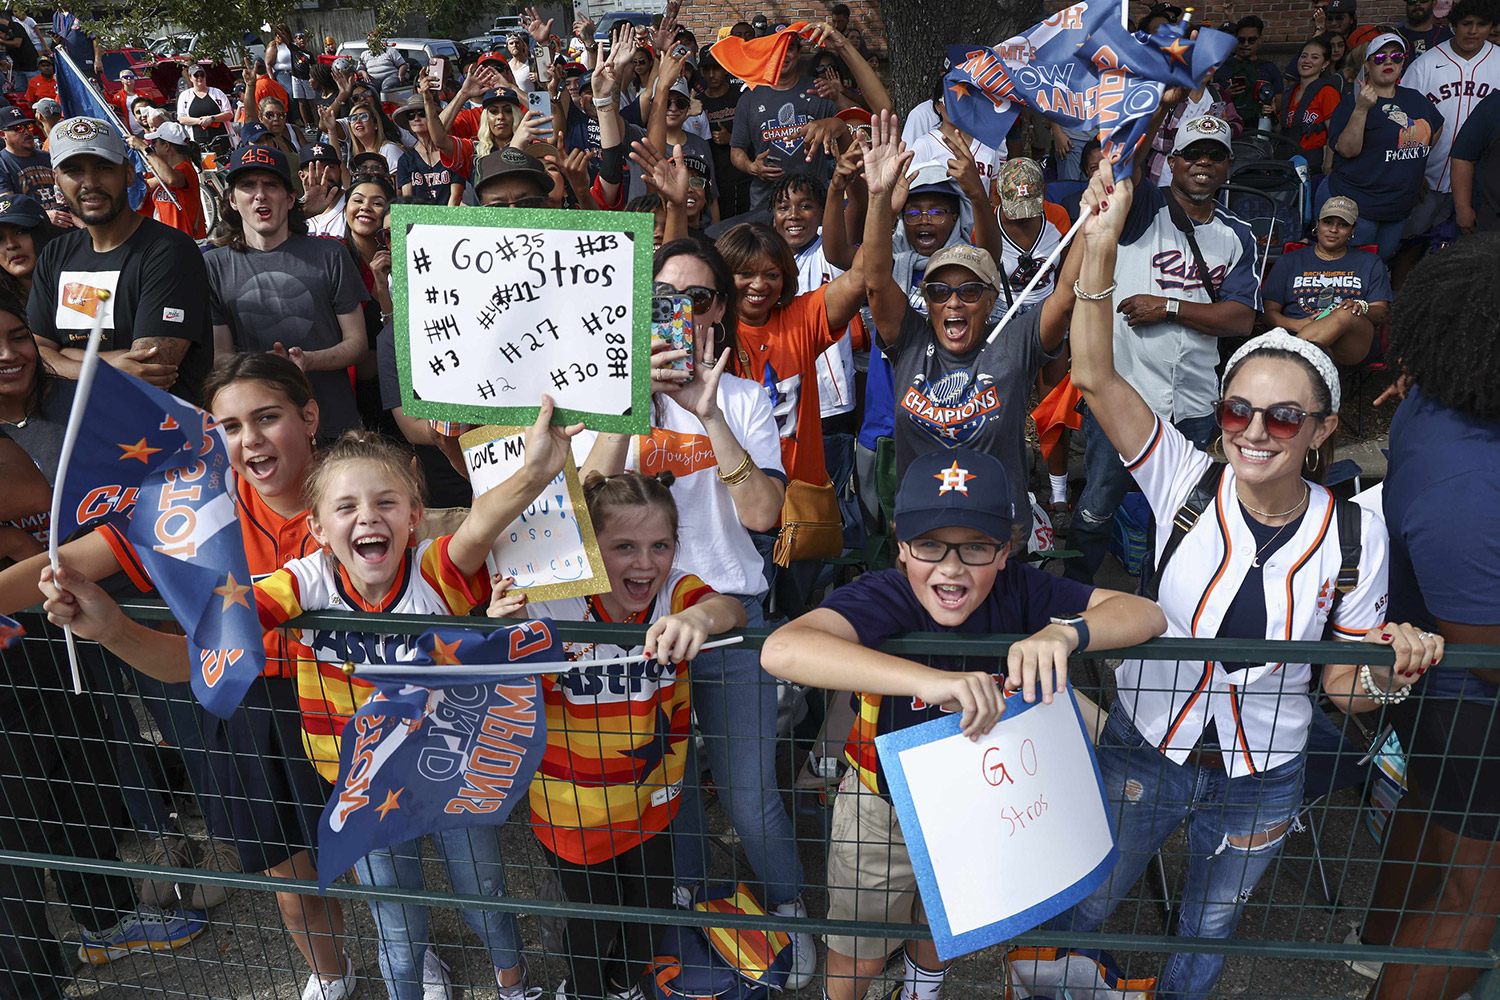 We know there are all kinds of supposed truisms when it comes to making and, ideally, winning the World Series. You have to score the most runs, but you also have to allow the fewest runs. You definitely can't give up extra runs in the field. Outspending the competition surely doesn't hurt, either. Ultimately, your best bet is to do all of the aforementioned (& maybe even bang on some trash cans along the way). What I thought I'd do was go through the last ten full seasons of World Series match-ups to see what, if any, patterns could be gleaned. Below I've listed out those last ten full-season World Series entrants, with the winner at the top. Following in order, are their respective position player WAR, DRS, and runs allowed WAR (all via FanGraphs), plus their Opening Day Payroll via Cot's. MLB ranks for that season within each category are in parentheses. 2012 SFG: 29.0 WAR (3rd) | +11 DRS (11th) | 12.8 rWAR (18th) | $131M (6th) DET: 20.5 WAR (15th) | -29 DRS (24th) | 19.5 rWAR (10th) | $134M (5th) [This payroll match-up represents the second highest by combined rank in the sample, which is interesting because outside of the Giants position players, neither team got much bang for their buck beside the whole "making the World Series over a bunch of better regular season teams" thing.] 2013 BOS: 36.2 WAR (1st) | +22 DRS (11th) | 22.3 rWAR (6th) | $155M (4th) STL: 26.1 WAR (5th) | -38 DRS (22nd) | 18.1 rWAR (10th) | $117M (12th) [Cardinals with an uncharacteristically poor showing on defense, one of only four teams in the sample with a negative DRS. Spoiler Alert: they all lost their respective WS. Red Sox were the better team across the board, and not even Cardinal devil magic could prevail.] 2014 SFG: 25.4 WAR (6th) | +20 DRS (9th) | 10.8 rWAR (24th) | $149M (7th) KCR: 18.8 WAR (12th) | +27 DRS (8th) | 24.3 rWAR (3rd) | $92M (20th) [Royals with the lowest position player WAR in the sample versus Giants with the lowest rWAR in the sample. Ultimately Mad Bum going berserk was too much for Ned Yost's scrappy underdogs to overcome.] 2015 KCR: 21.8 WAR (9th) | +35 DRS (2nd) | 21.8 rWAR (4th) | $113M (17th) NYM: 24.6 WAR (6th) | -11 DRS (17th) | 18.1 rWAR (9th) | $101M (21st) [The titular bizarro 2015 Fall Classic. The Royals, somehow with a higher Opening Day payroll than the New York City Metropolitans, and with the aforementioned Ned Yost captaining the ship by batting Alcides Escobar lead off...you know what, it's so crazy it might just work.] 2016 CHC: 35.9 WAR (1st) | +107 DRS (1st) | 31.3 rWAR (1st) | $172M (6th) CLE: 24.0 WAR (6th) | +41 DRS (7th) | 21.0 rWAR (4th) | $96M (23rd) [Cleveland put together a shoestring juggernaut for one of only two teams in the sample with an OD payroll below $100M. Unfortunately, they ran into maybe the most juggernaut-iest team in the whole sample as the Cubs were the only entrant to rank first in all three position players WAR, DRS, and runs allowed WAR. It sounds like a dynasty in the making; sure, they'll show up some more in subsequent years.] 2017 HOU: 37.2 WAR (1st) | +21 DRS (14th) | 17.6 WAR (10th) | $124M (17th) LAD: 30.3 WAR (2nd) | +65 DRS (2nd) | 26.1 rWAR (5th) | $241M (1st) [Astros' first World Series winner was the last one with a bottom-half OD payroll and one of only two Fall Classic winners in the sample. It feels a little weird looking back on the most dominant team of the last six years as an underdog here, but the Dodgers had a more balanced squad, almost doubled them in OD payroll, and it ended up not mattering.] 2018 BOS: 32.3 WAR (2nd) | +10 DRS (15th) | 24.3 rWAR (3rd) | $234M (1st) LAD: 34.1 WAR (1st) | +55 DRS (5th) | 19.9 rWAR (9th) | $187M (3rd) [The highest match-up in the sample by OD payroll rank. But ultimately, as it was always ordained to be Mookie Betts, no wait Chris Sale, oops make that David Price, ok had to be JD Martinez, scratch that, Steve Pearce who toppled the mighty Dodgers and took home World Series MVP before returning to being Steve Pearce.] 2019 WAS: 28.2 WAR (5th) | +26 DRS (12th) | 21.1 rWAR (8th) | $197M (4th) HOU: 42.0 WAR (1st) | +97 DRS (2nd) | 31.3 rWAR (1st) | $158M (9th) [Astros had the highest position player WAR in the sample, the second highest DRS in the sample, and the second highest runs allowed WAR in the sample. Right there with the 2016 Cubs across the board, maybe even ahead of them when you add it all up. But Strasburg and a freshly twenty-one-year-old Juan Soto were too much for Houston to handle.] 2021 ATL: 24.0 WAR (8th) | +50 DRS (8th) | 22.4 rWAR (7th) | $131M (10th) HOU: 33.7 WAR (1st) | +76 DRS (3rd) | 23.5 rWAR (5th) | $188M (5th) [Once again, the Astros found themselves in the World Series with the better team, though the pitching was close. When the dust settled, Houston's collection of stars at the plate couldn't quite keep pace with World Series MVP Jorge Soler, who promptly returned to being Steve Pearce.] 2022 HOU: 29.5 WAR (6th) | +67 DRS (5th) | 33.0 rWAR (2nd) | $175M (10th) PHI: 21.6 WAR (11th) | -33 DRS (25th) | 18.0 rWAR (9th) | $229M (4th) [Despite having the third highest OD payroll in the sample by actual cash, the Phillies team is one of the more underwhelming entrants in the sample with the 3rd lowest position player WAR, 2nd worst DRS, and a bottom six pitching staff. Astros just keep biting that apple.] CATEGORY NOTES Position Player WAR: the WS team with higher position player WAR has gone 6-4 in the last ten full season World Series. The average winner has had 30.0 WAR and a 4th ranking; the average loser has 27.6 WAR and a 6th ranking. The last three #1 ranked teams in this category have lost the WS, the lowest to win were 2015 KCR (9th) and 2021 ATL (8th). Defensive Runs Saved: as noted earlier, the only four teams to make the Fall Classic with negative DRS lost. The overall theme is just coming out in the positive with a 5-5 record for teams with the better DRS. 2018 BOS at +10 DRS (15th) was the worst fielding team to win a WS in the sample. Runs Allowed WAR: another split at 5-5 for the team with the better rWAR, though the two San Francisco teams, skew the sample somewhat. Losing teams averaged 22.0 WAR and a 7th ranking; winning teams with SF included came in at 21.7 WAR and an 8th ranking. Remove their two outlier seasons, and it goes to a 5-3 record with 24.2 WAR and a 4th ranking for the other eight WS winners in the sample. Opening Day Payroll: the team with the higher OD payroll has gone 6-4 during the sample. Only three Fall Classics in the sample featured two top ten OD payrolls - 2012 (#6 vs. #5), 2018 (#1 vs. #3), and 2019 (#4 vs. #9). The last two World Series have featured payroll upsets, and only two #1 payrolls have even made the last ten Fall Classics, not good signs for Stevzie Cohen. At the same time, the Brewers currently clock in 20th in OD payroll with only three teams making the last ten Fall Classics with a payroll that low, and all three losing at that. These are not good signs for Brewers fans, either. Another possible trend to keep an eye on with regards to OD payroll from 2012-17 is the cumulative rank of WS participants was about 23; there were a lot more mid and small markets represented, with half the WS teams ranking 12th or lower. From 2018-22 that cumulative rank has been about 12 to 13, with only two teams (25%) ranking 10th or lower, though those same two teams also won the last two World Series, to remind us how random this whole enterprise truly is. What do you think? Is there anything we missed? Something in the numbers that jump out to your eyes?
-
Brewers Defensive Runs Saved… 2022: +55 DRS (7th) 2021: +61 DRS (6th) 2019: +26 DRS (13th) 2018: +121 DRS (2nd) Add it all up an the Brewers are 4th in Defensive Runs Saved over the last five years. If Arnold is anything like Stearns, the Brewers defense should end up among the better units in MLB once again.
-
Bullpen kinda sucked last year too outside of DW, Box and first two months of Hader. Devin Williams posted 2.2 rWAR | 2.2 fWAR | +3.46 WPA in his 60 IP. The rest of the Brewers relievers posted 0.7 rWAR | 0.3 fWAR | -1.78 WPA in their 536 IP. Hopefully shouldn't be too hard to improve on that level of production.
-
Not sure if it happened in any kind of lab, but Chourio, Frelick, Wiemer, Mitchell, Turang, Black & others have developed pretty nicely in the last year plus. On the MLB side Brewers improved from 12th to 10th in runs scored, went from a 98 position player wRC+ up to a 104 mark and saw a 5 WAR increase from 2021 to 2022. Just need to hold those gains on the position player side and get the pitching back closer to 2021 levels (26.6 rWAR, 3rd) than where it was last year (15.9 rWAR, 14th).
-
All he needs to do to get Adames number of at bats is become an above average defensive shortstop, drop his K rate about 15% and raise his OPS vs LHP by about 200 points. Looks like no other MLB club was willing to give him that opportunity despite his OPS vs RHP in 134 ABs last year.
-
Yeah, 14 games. Which to his credit is 14 more games than Miller had in CF prior to ST.
-
This whole no-real-backup-outfielders situation on the OD roster is kind of dumb. Yelich, Mitchell and Anderson are the only viable OF on the roster, Winker should never be out there so your next guys up are Miller? Turang? Brosseau? Hopefully they don't wait until Taylor is back before doing something about it.
-
How is it obvious they bungled anything? He was up for all of 2020 and hit for an 88 wRC+ with a 34.6% K rate. Ok, whatever, it was the pandemic. Write it off. Try again next year. Keston got regular PT to start 2021 and put up a 43 wRC+ with a 36.0% K rate before being demoted on May 2. They called him back up for 5/24 to 6/6 but he put up a -36 wRC+ (yes, that is a negative wRC+) and 48.5% K rate. Jackson got 26 plate appearances in AA as an 18 year old. His K rate (& all other stats besides being 18 in AA) at Biloxi is statistical noise. Chourio's K rate actually declined from 28.0% to 21.8% over a much larger (though still small) sample when he moved from A up to A+.
-
300/30/100 for Keston? Must be some good stuff in that pipe.
-
What Level Will Prospects Begin in 2023?
sveumrules replied to jay87shot's topic in Brewers Minor League Talk
The search for a position continues, career Tyler is at… 50 G | 418 innings at 2B 29 G | 244 innings in OF (mostly CF) 6 G | 52 innings at 3B Still kinda think he ends up at 1B/LF, but doesn’t hurt to try him farther up the spectrum just to see how he does. -
At least with Voit, I can squint and see the upside with a 140 wRC+ vs LHP from 2018-20. I don't think he'll get back there, but even something like his career 110 mark against southpaws would be a big upgrade over Hiura anyway. With Miller, I just don't see it. The minor league track record is nice, but the MLB results have been ugly pretty much across the board. Among 261 players with at least 600 PAs over the last two years he is at... -0.4 WAR (247th) 74 wRC+ (244th) .231 AVG (211th) 6.1 BB% (214th) .107 ISO (234th) Even his 91st percentile speed according to StatCast has resulted in -1.4 BSR. I guess he's our best defensive 1B?
-
Miller has a 65 wRC+ for his career vs LHP. I'd hope they'd go with Brosseau (career 117 wRC+ vs LHP) instead.
-
Entering 2018 the Central looked like a runaway. FanGraphs had it CHI (81%) STL (15%) MIL (3%) to win the division. As we all know, the Crew took it in 163 with the Cubs settling for the WC. Preseason 2019 was a little more even spread at CHC (47%) STL (26%) MIL (15%) and even CIN (7%) to win the division. Cards deployed their devil magic, Crew made the WC with a miracle run, Cubs flopped. Coming into 2021, Central was wide open at MIL (37%) STL (25%) CHI (19%) CIN (18%). Looked like it’d come down to the wire, so of course the Crew won it going away. By 2022 the FG computers were finally convinced on the Crew, giving them 72% division odds vs only 21% for the Cards. Naturally STL prevailed with a cushion. Best part about every new season for me are all the surprises in store. Pretending to know how every thing will turn out before it even begins seems like it would suck most of the fun out of things.