
.jpg.cc012630838b9a00fd2a2371995d5f38.jpg)

sveumrules
-
Posts
10,786 -
Joined
-
Last visited
-
Days Won
210
Content Type
Profiles
Forums
Blogs
Events
News
2026 Milwaukee Brewers Top Prospects Ranking
Milwaukee Brewers Videos
2022 Milwaukee Brewers Draft Picks
Milwaukee Brewers Free Agent & Trade Rumors, Notes, & Tidbits
Guides & Resources
2023 Milwaukee Brewers Draft Picks
2024 Milwaukee Brewers Draft Picks
The Milwaukee Brewers Players Project
2025 Milwaukee Brewers Draft Pick Tracker
2026 Milwaukee Brewers Draft Tracker: Picks & Bonuses
Store
Downloads
Gallery
Everything posted by sveumrules
-
Did the same thing the other day. Only six games vs NLC teams of the first 18 games so far. Don’t play another NLC team until game 41 on May 15th. Don’t play CIN for the first time until June 2nd (57th game), don’t play PIT for the first time until June 16th (69th game).
-
Obviously super early still, but refreshing nonetheless to look at the standings and see the Rays, Twins, Rangers and DBacks all joining the Brewers atop their respective divisions. Even the Braves topping the NLE is kinda underdog vibes given Cohen’s offseason spending spree.
-
With 10% of the season in the books, here’s how the projections have shifted… BPro MIL: 89 W | 67% Div | 80% PO STL: 84 W | 26% Div | 44% PO 538 MIL: 92 W | 64% Div | 81% PO STL: 83 W | 19% Div | 44% PO FanGraphs MIL: 88 W | 51% Div | 71% PO STL: 86 W | 36% Div | 59% PO Cubs still projected just under .500 in that 78-80 win range. Next opponents for MIL are at SEA, vs BOS, vs DET and vs LAA. Cardinals have vs ARI, at SEA, at SFG and at LAD coming up.
-
Crowd looked decent (for the Trop) on the highlights I saw. Checked their attendance and it was 21K last night vs 25K (which is a sellout for the Trop) on opening day and as low as 11K earlier in the week on Sunday. Outside of four Yankees games and Opening Day, the Rays only had two home games over 21K in 2022, so I guess that’s a pretty strong turnout for them.
-
 Awesome to see Sparks starting off hot out of the gate. Thought the AA placement out of Indy ball was aggressive, but looks like he had reached A+ previously with the Orioles in 2021 (and posted a respectable 102 wRC+) so maybe not. Would be pretty rad to unearth a possible gem on the position player side to go along with all the potential arms. Has anybody ever compiled a full list of pitchers in the system signed out of the Indy leagues? I know Topa was traded, but Cousins, Meeker, Middendorf, Thompson all come immediately to mind and I’m sure I’m missing some others.
- 10 replies
-
- 1
-

-
- keston hiura
- luke adams
- (and 3 more)
-
Brewers team ERA of 2.83 ranks 4th, their 4.28 FIP is right in the middle at 15th and their 4.57 xFIP ranks 17th. Regression is surely incoming, it’ll just come down to how much, though it should also be noted the Brewers team ERA has beaten their FIP in every full season since 2016 leading to the 4th best cumulative margin in MLB during that time. Tough to read too much into the numbers when the samples are still so small and noisy this early on, even at the team level. Here are the ranges from best to worst for last year vs so far this year… Team ERA 2022: 2.80 to 5.08 2023: 2.17 to 7.54 Team K/9 2022: 9.79 to 7.38 2023: 10.61 to 6.35 Team HR/9 2022: 0.83 to 1.56 2023: 0.42 to 1.97 Looking at the projections, FanGraphs has them 12th for rest of season runs allowed and BPro has them around 8th/9th. That range feels more accurate to me of where they’ll likely end up than either of their current ERA or FIP/xFIP rankings to this point.
-
Ichiro was a superb defender (3rd all time in DRS for a RF) with one of the best OF arms of all time. Frelick is a maybe CF/probably LF with a middling arm. Cain and Gomez were elite defensive CFers, ranking 2nd and 10th among all CFs since DRS was created 20 years ago. Frelick is highly unlikely to match that kind of production in the field. Speedy OF with plate discipline and contact over power, but not quite skilled enough with the glove to be an everyday CF…sounds a lot like former Brewer Darryl Hamilton to me.
-
Clayton will be lucky to carve out a career as anything more than an up/down optionable reliever at this point. Asking him to face AAA pitchers after four years of not hitting professionally might be stretching him a little thin.
-
Sounds like Oneil Cruz fractured his left ankle in a play at the plate today.
-
Right now the various projections have the bottom three in the NLC with the following win totals… FanGraphs CHI (78) PIT (76) CIN (71) 538 CHI (77) PIT (73) CIN (70) BPro CHI (76) PIT (73) CIN (70) I’d still be selling on both, but they aren’t that far behind the Cubs for 3rd and a number of teams beat (or underachieve) their projections by eight plus wins every season so it’s not too far out there. The Reds on the other hand…
-
Looks like both Zach Vennaro and Harold Chirino saw velocity bumps this spring and were added to the Brewers board over at FanGraphs with these reports… “Another Indy Ball find for the Brewers, Vennaro was signed after pitching in the Can Am League, and it took extra time for his career to get off of the ground because of the pandemic. After toiling away in the mid-minors for a couple of years, Vennaro showed a nearly three-tick velo boost during the spring of 2023, his fastball moving from 93-95 mph into the 95-98 mph range. To call his delivery funky doesn't do it justice. If Adam Cimber's delivery is George Porter Jr., Vennaro's is Les Claypool. He gets deep into his rear leg and strides open as his arm swings with huge length all the way behind his body before he delivers from a sidearm slot. He's throwing 96 or so with huge tail and sink, and very little feel for location. Command issues and Vennaro's lack of a pitch to deal with opposite-handed hitters limits him to an up/down forecast, but he has uncommonly nasty stuff for that sort of role.” ”Chirino showed a velocity bump in the spring of 2023, working 94-97 with sink while mixing in a two-plane curveball in the 80-84 mph range. He looks like a quality up/down middle inning option.”
-
Your 2023 Wisconsin Timber Rattlers
sveumrules replied to Jim Goulart's topic in Brewers Minor League Talk
245 SB vs only 34 CS the last two years. At a certain point a catcher needs to be able to throw people out. -
Give us your best tips on watching a game at AmFam
sveumrules replied to Brock Beauchamp's topic in Milwaukee Brewers Talk
Their ranking already fell off last season, though the raw per game numbers bounced back above where they were the last time the team was truly non-competitive. Full season ranks… 2016: 16th (28,6K) 2017: 10th (31.3K) 2018: 10th (35.2K) 2019: 7th (36.1K) 2021: 10th (22.5K) 2022: 14th (29.9K) A lot will depend on how the team is playing, last years timing was pretty much the worst possible because they had the best start in franchise history then fell apart starting right when attendance normally picks up after school lets out & the mediocrity continued through dealing Hader and the end of the season. If they are in the race and make a move to buy at the deadline this year they should have no problem getting back over 30K per game and closer to Top Ten range. Get off to a bad start, deal some combo of Burnes, Woody, Adames at the deadline would probably tank attendance back into the bottom half of the league. -
Both Carloses Rodriguezes on the same Shuckers squad…the singularity is upon us.
-
You think they went home after the game with the off day today? Or is everyone sitting around in their hotel rooms with this weather? Then throw in what looks like another weather day that could cancel Saturday. Play a doubleheader Sunday if it clears, or just make it up later in the season? Just kind of weird vibes/no rhythm all around to start a season. If only there was a stadium with a roof like 69 miles north or whatever.
-
Thought I’d start a thread to keep track of the various projection systems in one spot as the season goes on. After Brewers & Cardinals losses on Opening Day it looks like… BPro MIL: 86 W | 52% Div | 62% PO STL: 85 W | 39% Div | 53% PO 538 MIL: 86 W | 41% Div | 58% PO STL: 85 W | 38% Div | 55% PO FanGraphs STL: 87 W | 50% Div | 66.6% PO MIL: 85 W | 39% Div | 57% PO Rounded off the percentages but that FG playoff percentage for the Cardinals was a little too on the nose so I left it alone.
-
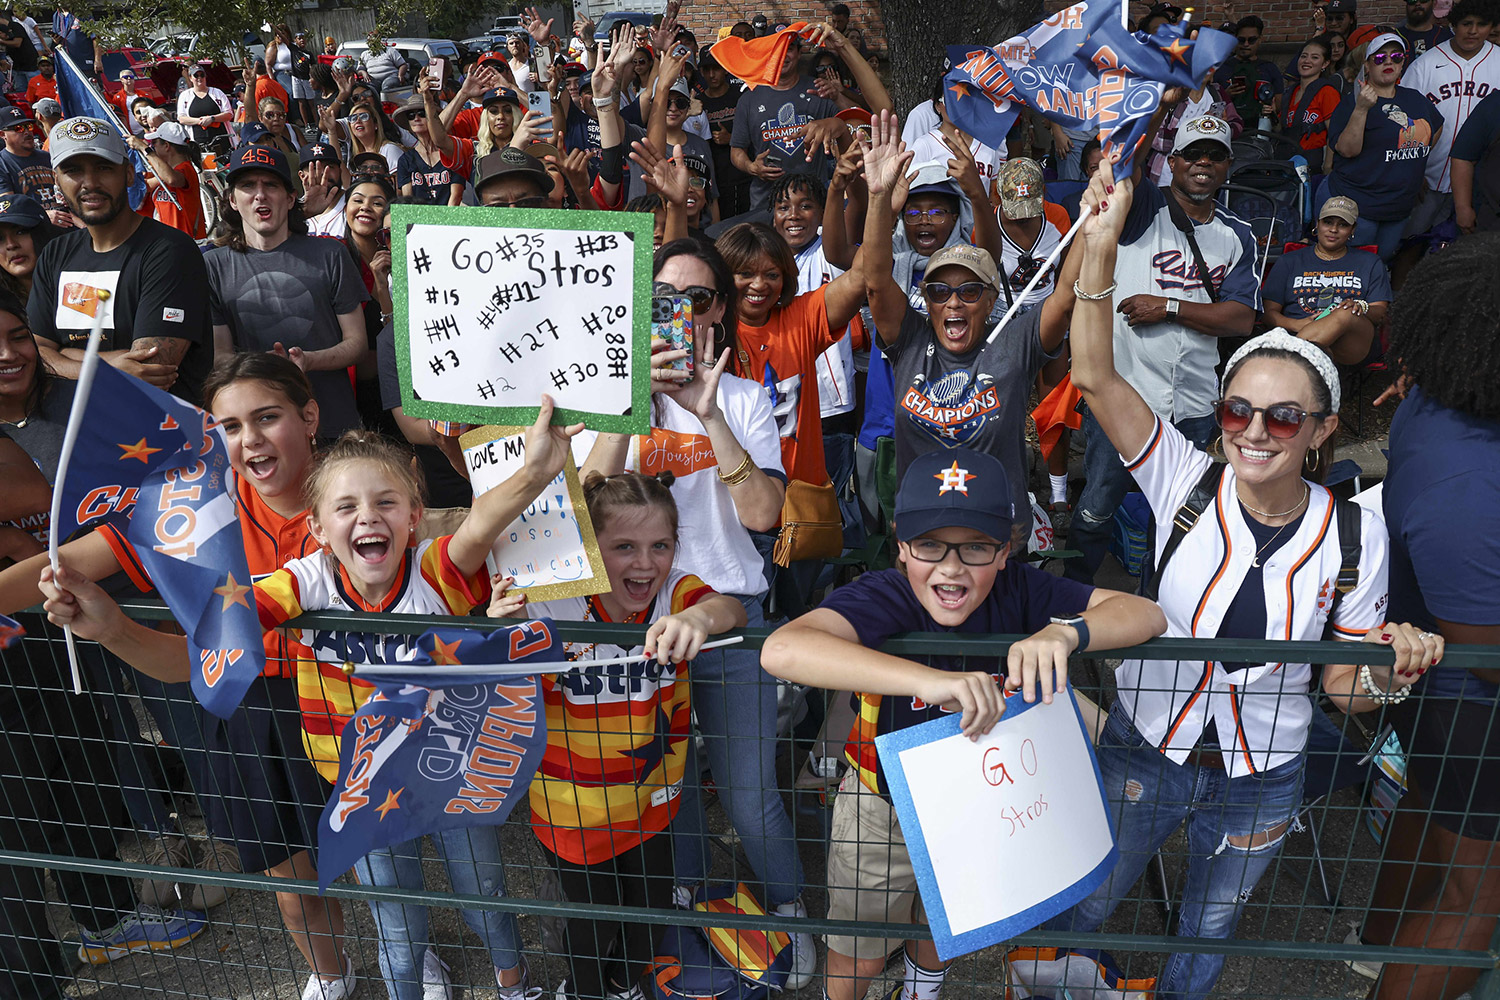 We know there are all kinds of supposed truisms when it comes to making and, ideally, winning the World Series. You have to score the most runs, but you also have to allow the fewest runs. You definitely can't give up extra runs in the field. Outspending the competition surely doesn't hurt, either. Ultimately, your best bet is to do all of the aforementioned (& maybe even bang on some trash cans along the way). What I thought I'd do was go through the last ten full seasons of World Series match-ups to see what, if any, patterns could be gleaned. Below I've listed out those last ten full-season World Series entrants, with the winner at the top. Following in order, are their respective position player WAR, DRS, and runs allowed WAR (all via FanGraphs), plus their Opening Day Payroll via Cot's. MLB ranks for that season within each category are in parentheses. 2012 SFG: 29.0 WAR (3rd) | +11 DRS (11th) | 12.8 rWAR (18th) | $131M (6th) DET: 20.5 WAR (15th) | -29 DRS (24th) | 19.5 rWAR (10th) | $134M (5th) [This payroll match-up represents the second highest by combined rank in the sample, which is interesting because outside of the Giants position players, neither team got much bang for their buck beside the whole "making the World Series over a bunch of better regular season teams" thing.] 2013 BOS: 36.2 WAR (1st) | +22 DRS (11th) | 22.3 rWAR (6th) | $155M (4th) STL: 26.1 WAR (5th) | -38 DRS (22nd) | 18.1 rWAR (10th) | $117M (12th) [Cardinals with an uncharacteristically poor showing on defense, one of only four teams in the sample with a negative DRS. Spoiler Alert: they all lost their respective WS. Red Sox were the better team across the board, and not even Cardinal devil magic could prevail.] 2014 SFG: 25.4 WAR (6th) | +20 DRS (9th) | 10.8 rWAR (24th) | $149M (7th) KCR: 18.8 WAR (12th) | +27 DRS (8th) | 24.3 rWAR (3rd) | $92M (20th) [Royals with the lowest position player WAR in the sample versus Giants with the lowest rWAR in the sample. Ultimately Mad Bum going berserk was too much for Ned Yost's scrappy underdogs to overcome.] 2015 KCR: 21.8 WAR (9th) | +35 DRS (2nd) | 21.8 rWAR (4th) | $113M (17th) NYM: 24.6 WAR (6th) | -11 DRS (17th) | 18.1 rWAR (9th) | $101M (21st) [The titular bizarro 2015 Fall Classic. The Royals, somehow with a higher Opening Day payroll than the New York City Metropolitans, and with the aforementioned Ned Yost captaining the ship by batting Alcides Escobar lead off...you know what, it's so crazy it might just work.] 2016 CHC: 35.9 WAR (1st) | +107 DRS (1st) | 31.3 rWAR (1st) | $172M (6th) CLE: 24.0 WAR (6th) | +41 DRS (7th) | 21.0 rWAR (4th) | $96M (23rd) [Cleveland put together a shoestring juggernaut for one of only two teams in the sample with an OD payroll below $100M. Unfortunately, they ran into maybe the most juggernaut-iest team in the whole sample as the Cubs were the only entrant to rank first in all three position players WAR, DRS, and runs allowed WAR. It sounds like a dynasty in the making; sure, they'll show up some more in subsequent years.] 2017 HOU: 37.2 WAR (1st) | +21 DRS (14th) | 17.6 WAR (10th) | $124M (17th) LAD: 30.3 WAR (2nd) | +65 DRS (2nd) | 26.1 rWAR (5th) | $241M (1st) [Astros' first World Series winner was the last one with a bottom-half OD payroll and one of only two Fall Classic winners in the sample. It feels a little weird looking back on the most dominant team of the last six years as an underdog here, but the Dodgers had a more balanced squad, almost doubled them in OD payroll, and it ended up not mattering.] 2018 BOS: 32.3 WAR (2nd) | +10 DRS (15th) | 24.3 rWAR (3rd) | $234M (1st) LAD: 34.1 WAR (1st) | +55 DRS (5th) | 19.9 rWAR (9th) | $187M (3rd) [The highest match-up in the sample by OD payroll rank. But ultimately, as it was always ordained to be Mookie Betts, no wait Chris Sale, oops make that David Price, ok had to be JD Martinez, scratch that, Steve Pearce who toppled the mighty Dodgers and took home World Series MVP before returning to being Steve Pearce.] 2019 WAS: 28.2 WAR (5th) | +26 DRS (12th) | 21.1 rWAR (8th) | $197M (4th) HOU: 42.0 WAR (1st) | +97 DRS (2nd) | 31.3 rWAR (1st) | $158M (9th) [Astros had the highest position player WAR in the sample, the second highest DRS in the sample, and the second highest runs allowed WAR in the sample. Right there with the 2016 Cubs across the board, maybe even ahead of them when you add it all up. But Strasburg and a freshly twenty-one-year-old Juan Soto were too much for Houston to handle.] 2021 ATL: 24.0 WAR (8th) | +50 DRS (8th) | 22.4 rWAR (7th) | $131M (10th) HOU: 33.7 WAR (1st) | +76 DRS (3rd) | 23.5 rWAR (5th) | $188M (5th) [Once again, the Astros found themselves in the World Series with the better team, though the pitching was close. When the dust settled, Houston's collection of stars at the plate couldn't quite keep pace with World Series MVP Jorge Soler, who promptly returned to being Steve Pearce.] 2022 HOU: 29.5 WAR (6th) | +67 DRS (5th) | 33.0 rWAR (2nd) | $175M (10th) PHI: 21.6 WAR (11th) | -33 DRS (25th) | 18.0 rWAR (9th) | $229M (4th) [Despite having the third highest OD payroll in the sample by actual cash, the Phillies team is one of the more underwhelming entrants in the sample with the 3rd lowest position player WAR, 2nd worst DRS, and a bottom six pitching staff. Astros just keep biting that apple.] CATEGORY NOTES Position Player WAR: the WS team with higher position player WAR has gone 6-4 in the last ten full season World Series. The average winner has had 30.0 WAR and a 4th ranking; the average loser has 27.6 WAR and a 6th ranking. The last three #1 ranked teams in this category have lost the WS, the lowest to win were 2015 KCR (9th) and 2021 ATL (8th). Defensive Runs Saved: as noted earlier, the only four teams to make the Fall Classic with negative DRS lost. The overall theme is just coming out in the positive with a 5-5 record for teams with the better DRS. 2018 BOS at +10 DRS (15th) was the worst fielding team to win a WS in the sample. Runs Allowed WAR: another split at 5-5 for the team with the better rWAR, though the two San Francisco teams, skew the sample somewhat. Losing teams averaged 22.0 WAR and a 7th ranking; winning teams with SF included came in at 21.7 WAR and an 8th ranking. Remove their two outlier seasons, and it goes to a 5-3 record with 24.2 WAR and a 4th ranking for the other eight WS winners in the sample. Opening Day Payroll: the team with the higher OD payroll has gone 6-4 during the sample. Only three Fall Classics in the sample featured two top ten OD payrolls - 2012 (#6 vs. #5), 2018 (#1 vs. #3), and 2019 (#4 vs. #9). The last two World Series have featured payroll upsets, and only two #1 payrolls have even made the last ten Fall Classics, not good signs for Stevzie Cohen. At the same time, the Brewers currently clock in 20th in OD payroll with only three teams making the last ten Fall Classics with a payroll that low, and all three losing at that. These are not good signs for Brewers fans, either. Another possible trend to keep an eye on with regards to OD payroll from 2012-17 is the cumulative rank of WS participants was about 23; there were a lot more mid and small markets represented, with half the WS teams ranking 12th or lower. From 2018-22 that cumulative rank has been about 12 to 13, with only two teams (25%) ranking 10th or lower, though those same two teams also won the last two World Series, to remind us how random this whole enterprise truly is. What do you think? Is there anything we missed? Something in the numbers that jump out to your eyes?
 -
No, really. How long ago was 2015? It was "only" eight years ago, but what if I told you the two teams that met in the World Series that year entered the season with the 17th and 21st-ranked payrolls in MLB? Seems pretty inconceivable, eh? That would be like if the Twins & Diamondbacks met in the World Series this year. That'd be cool. Not as cool as the Brewers making it, but still better than the Yankees and Mets or whoever. Image courtesy of © Troy Taormina-USA TODAY Sports We know there are all kinds of supposed truisms when it comes to making and, ideally, winning the World Series. You have to score the most runs, but you also have to allow the fewest runs. You definitely can't give up extra runs in the field. Outspending the competition surely doesn't hurt, either. Ultimately, your best bet is to do all of the aforementioned (& maybe even bang on some trash cans along the way). What I thought I'd do was go through the last ten full seasons of World Series match-ups to see what, if any, patterns could be gleaned. Below I've listed out those last ten full-season World Series entrants, with the winner at the top. Following in order, are their respective position player WAR, DRS, and runs allowed WAR (all via FanGraphs), plus their Opening Day Payroll via Cot's. MLB ranks for that season within each category are in parentheses. 2012 SFG: 29.0 WAR (3rd) | +11 DRS (11th) | 12.8 rWAR (18th) | $131M (6th) DET: 20.5 WAR (15th) | -29 DRS (24th) | 19.5 rWAR (10th) | $134M (5th) [This payroll match-up represents the second highest by combined rank in the sample, which is interesting because outside of the Giants position players, neither team got much bang for their buck beside the whole "making the World Series over a bunch of better regular season teams" thing.] 2013 BOS: 36.2 WAR (1st) | +22 DRS (11th) | 22.3 rWAR (6th) | $155M (4th) STL: 26.1 WAR (5th) | -38 DRS (22nd) | 18.1 rWAR (10th) | $117M (12th) [Cardinals with an uncharacteristically poor showing on defense, one of only four teams in the sample with a negative DRS. Spoiler Alert: they all lost their respective WS. Red Sox were the better team across the board, and not even Cardinal devil magic could prevail.] 2014 SFG: 25.4 WAR (6th) | +20 DRS (9th) | 10.8 rWAR (24th) | $149M (7th) KCR: 18.8 WAR (12th) | +27 DRS (8th) | 24.3 rWAR (3rd) | $92M (20th) [Royals with the lowest position player WAR in the sample versus Giants with the lowest rWAR in the sample. Ultimately Mad Bum going berserk was too much for Ned Yost's scrappy underdogs to overcome.] 2015 KCR: 21.8 WAR (9th) | +35 DRS (2nd) | 21.8 rWAR (4th) | $113M (17th) NYM: 24.6 WAR (6th) | -11 DRS (17th) | 18.1 rWAR (9th) | $101M (21st) [The titular bizarro 2015 Fall Classic. The Royals, somehow with a higher Opening Day payroll than the New York City Metropolitans, and with the aforementioned Ned Yost captaining the ship by batting Alcides Escobar lead off...you know what, it's so crazy it might just work.] 2016 CHC: 35.9 WAR (1st) | +107 DRS (1st) | 31.3 rWAR (1st) | $172M (6th) CLE: 24.0 WAR (6th) | +41 DRS (7th) | 21.0 rWAR (4th) | $96M (23rd) [Cleveland put together a shoestring juggernaut for one of only two teams in the sample with an OD payroll below $100M. Unfortunately, they ran into maybe the most juggernaut-iest team in the whole sample as the Cubs were the only entrant to rank first in all three position players WAR, DRS, and runs allowed WAR. It sounds like a dynasty in the making; sure, they'll show up some more in subsequent years.] 2017 HOU: 37.2 WAR (1st) | +21 DRS (14th) | 17.6 WAR (10th) | $124M (17th) LAD: 30.3 WAR (2nd) | +65 DRS (2nd) | 26.1 rWAR (5th) | $241M (1st) [Astros' first World Series winner was the last one with a bottom-half OD payroll and one of only two Fall Classic winners in the sample. It feels a little weird looking back on the most dominant team of the last six years as an underdog here, but the Dodgers had a more balanced squad, almost doubled them in OD payroll, and it ended up not mattering.] 2018 BOS: 32.3 WAR (2nd) | +10 DRS (15th) | 24.3 rWAR (3rd) | $234M (1st) LAD: 34.1 WAR (1st) | +55 DRS (5th) | 19.9 rWAR (9th) | $187M (3rd) [The highest match-up in the sample by OD payroll rank. But ultimately, as it was always ordained to be Mookie Betts, no wait Chris Sale, oops make that David Price, ok had to be JD Martinez, scratch that, Steve Pearce who toppled the mighty Dodgers and took home World Series MVP before returning to being Steve Pearce.] 2019 WAS: 28.2 WAR (5th) | +26 DRS (12th) | 21.1 rWAR (8th) | $197M (4th) HOU: 42.0 WAR (1st) | +97 DRS (2nd) | 31.3 rWAR (1st) | $158M (9th) [Astros had the highest position player WAR in the sample, the second highest DRS in the sample, and the second highest runs allowed WAR in the sample. Right there with the 2016 Cubs across the board, maybe even ahead of them when you add it all up. But Strasburg and a freshly twenty-one-year-old Juan Soto were too much for Houston to handle.] 2021 ATL: 24.0 WAR (8th) | +50 DRS (8th) | 22.4 rWAR (7th) | $131M (10th) HOU: 33.7 WAR (1st) | +76 DRS (3rd) | 23.5 rWAR (5th) | $188M (5th) [Once again, the Astros found themselves in the World Series with the better team, though the pitching was close. When the dust settled, Houston's collection of stars at the plate couldn't quite keep pace with World Series MVP Jorge Soler, who promptly returned to being Steve Pearce.] 2022 HOU: 29.5 WAR (6th) | +67 DRS (5th) | 33.0 rWAR (2nd) | $175M (10th) PHI: 21.6 WAR (11th) | -33 DRS (25th) | 18.0 rWAR (9th) | $229M (4th) [Despite having the third highest OD payroll in the sample by actual cash, the Phillies team is one of the more underwhelming entrants in the sample with the 3rd lowest position player WAR, 2nd worst DRS, and a bottom six pitching staff. Astros just keep biting that apple.] CATEGORY NOTES Position Player WAR: the WS team with higher position player WAR has gone 6-4 in the last ten full season World Series. The average winner has had 30.0 WAR and a 4th ranking; the average loser has 27.6 WAR and a 6th ranking. The last three #1 ranked teams in this category have lost the WS, the lowest to win were 2015 KCR (9th) and 2021 ATL (8th). Defensive Runs Saved: as noted earlier, the only four teams to make the Fall Classic with negative DRS lost. The overall theme is just coming out in the positive with a 5-5 record for teams with the better DRS. 2018 BOS at +10 DRS (15th) was the worst fielding team to win a WS in the sample. Runs Allowed WAR: another split at 5-5 for the team with the better rWAR, though the two San Francisco teams, skew the sample somewhat. Losing teams averaged 22.0 WAR and a 7th ranking; winning teams with SF included came in at 21.7 WAR and an 8th ranking. Remove their two outlier seasons, and it goes to a 5-3 record with 24.2 WAR and a 4th ranking for the other eight WS winners in the sample. Opening Day Payroll: the team with the higher OD payroll has gone 6-4 during the sample. Only three Fall Classics in the sample featured two top ten OD payrolls - 2012 (#6 vs. #5), 2018 (#1 vs. #3), and 2019 (#4 vs. #9). The last two World Series have featured payroll upsets, and only two #1 payrolls have even made the last ten Fall Classics, not good signs for Stevzie Cohen. At the same time, the Brewers currently clock in 20th in OD payroll with only three teams making the last ten Fall Classics with a payroll that low, and all three losing at that. These are not good signs for Brewers fans, either. Another possible trend to keep an eye on with regards to OD payroll from 2012-17 is the cumulative rank of WS participants was about 23; there were a lot more mid and small markets represented, with half the WS teams ranking 12th or lower. From 2018-22 that cumulative rank has been about 12 to 13, with only two teams (25%) ranking 10th or lower, though those same two teams also won the last two World Series, to remind us how random this whole enterprise truly is. What do you think? Is there anything we missed? Something in the numbers that jump out to your eyes? View full article
-
Bullpen kinda sucked last year too outside of DW, Box and first two months of Hader. Devin Williams posted 2.2 rWAR | 2.2 fWAR | +3.46 WPA in his 60 IP. The rest of the Brewers relievers posted 0.7 rWAR | 0.3 fWAR | -1.78 WPA in their 536 IP. Hopefully shouldn't be too hard to improve on that level of production.
-
Entering 2018 the Central looked like a runaway. FanGraphs had it CHI (81%) STL (15%) MIL (3%) to win the division. As we all know, the Crew took it in 163 with the Cubs settling for the WC. Preseason 2019 was a little more even spread at CHC (47%) STL (26%) MIL (15%) and even CIN (7%) to win the division. Cards deployed their devil magic, Crew made the WC with a miracle run, Cubs flopped. Coming into 2021, Central was wide open at MIL (37%) STL (25%) CHI (19%) CIN (18%). Looked like it’d come down to the wire, so of course the Crew won it going away. By 2022 the FG computers were finally convinced on the Crew, giving them 72% division odds vs only 21% for the Cards. Naturally STL prevailed with a cushion. Best part about every new season for me are all the surprises in store. Pretending to know how every thing will turn out before it even begins seems like it would suck most of the fun out of things.
-
Cubs lost 12 more games than the Brewers in 2022, the Reds lost 24 more games than the Brewers. I can squint and see how the Cubs could maybe challenge for 2nd, but I don’t see how the Reds added twenty plus wins this winter. I’d agree the Cards are the favorites after last year, but it’s by a pretty thin margin. FanGraphs has the Cards at 51% to win the division vs 39% for the Crew, but BPro has it flipped at 54% for MKE vs 38% for STL.
-
Turns out getting added to the 40 man in November didn’t guarantee Perkins a spot on the 26 man come March.
-
If Lutz has another solid but unspectacular season this year at AAA my guess would be he tries to find an org with less OF depth for 2024. As it stands now for 2024 Brewers would have Yelich (maybe transitioning to DH), Mitchell, Frelick, Wiemer, Taylor, Chourio all for sure ahead of him on the depth chart before getting into guys like Perkins (currently on 40 man) or Black (looking like he’ll be playing plenty of CF in Biloxi this year) or even Noah Campbell who has performed in the same general ballpark as Tristen over the last couple years but brings more positional versatility.
- 5 replies
-
- 2
-
-
- michele vassalotti
- karlos morales
- (and 3 more)
-
I’ll guess it ends up something like… Rodgers, #15 for #13, 2023 3rd (#74), 2024 2nd & 3rd Maybe a player gets thrown in or some conditions get added to the 2024 picks based on Jets postseason results or if Rodgers comes back for 2024.
-
Braves have optioned Vaughn Grissom and Braden Shewmake to AAA clearing the way for Orlando Arcia to open the season as Dansby Swanson’s replacement.


