


Jason Wang
-
Posts
955 -
Joined
-
Last visited
-
Days Won
1
Content Type
Profiles
Forums
Blogs
Events
News
2026 Milwaukee Brewers Top Prospects Ranking
Milwaukee Brewers Videos
2022 Milwaukee Brewers Draft Picks
Milwaukee Brewers Free Agent & Trade Rumors, Notes, & Tidbits
Guides & Resources
2023 Milwaukee Brewers Draft Picks
2024 Milwaukee Brewers Draft Picks
The Milwaukee Brewers Players Project
2025 Milwaukee Brewers Draft Pick Tracker
2026 Milwaukee Brewers Draft Tracker: Picks & Bonuses
Store
Downloads
Gallery
Everything posted by Jason Wang
-
 Image courtesy of © Benny Sieu-Imagn Images There have been so many tempting opportunities to throw in the towel this year as a Brewers fan. Maybe it was the way the team started off 0-4. Maybe it was the fact that, as recently as May 21st, the Brewers were below .500 and fourth in the NL Central. Or maybe you’re just generally pessimistic. Regardless of where you stand on the spectrum of optimism, it seems less debatable that the team has been less dominant this year than they have been in recent memory. The team’s playoff odds are currently hovering around the 30% mark, according to FanGraphs, while Baseball Reference provides more optimistic odds of around 40%. In both cases, Milwaukee has less than a coin-flip chance to make the playoffs, setting them up to miss October for just the second time in eight years. Given the current state of the division and the National League, this makes plenty of sense. The Chicago Cubs have seemed nearly unstoppable all season long, holding a dominant 42-28 record with the second-best run differential in MLB (+104). In addition to the big offseason acquisition of Kyle Tucker, Pete Crow-Armstrong has looked less like a defense-first center fielder and more like an MVP candidate, while Carson Kelly is having the best year of his career on all fronts by far. Even in the face of some starting pitching injuries, the rotation has managed to stay afloat thanks to a great year by Matthew Boyd and a solid year by Jameson Taillon. The Wild Card picture doesn’t seem much better, as a highly competitive NL West currently occupies two of the three total slots, with the Phillies claiming the final spot. To their credit, the Brewers are just 2.5 games out of the picture, but it won’t be an easy road forward. The future is even further muddied by the trade deadline, which inconveniently forces teams to classify themselves as buyers or sellers. If they’re willing to take their chances, the Brewers can fork over prospect equity and young talent to give them a better chance to reach the playoff bracket this season. Alternatively, they can trade away some of their impact players and hope that the scheduled bobblehead giveaways are enough to make up for the B-team product that will take the field for the final few months of the season. The case for selling is clear. In addition to the aforementioned obstacles standing between them and a postseason spot, they do have a few impending free agents who could be valuable assets to contenders. Rhys Hoskins has bounced back after a down year last year, and his 118 OPS+ could be a good fit for any team in need of help at first base. Freddy Peralta has a 2.69 ERA over his first 14 starts and would be an outstanding short-term starter rental. Heck, even Jose Quintana may have some suitors if he’s put on the market. In return, some infield and starting pitching depth would be ideal. The best part would be, at least for the front office, it’d allow the payroll to be cut even lower, something that seems to be a top priority based on the organization’s most recent roster move. But the Brewers’ hopes aren’t dead just yet. Sure, there has been discourse online about the possibility of Peralta and Hoskins being traded, but the Brewers haven’t demonstrated the same enthusiasm on the topic. Furthermore, although they were in the depths of the NL Central less than a month ago, they’ve managed to claw their way back, and things seem to be moving in the right direction. The pitching staff has combined for a 3.23 ERA, seventh best in MLB. They’ve called up phenom prospect Jacob Misiorowski and plan to make him an integral part of the rotation. The offense still leaves a little to be desired, especially when it comes to certain players, but other stars are starting to bring it back around. Christian Yelich has taken slight steps forward in the past month, Jackson Chourio’s June is looking much better than his May, and Joey Ortiz is almost back to being an acceptable bat. Almost. Because the Brewers are currently on the fence, the results of the next few weeks will help push them in one direction or the other. Nothing is certain, and the tone of this conversation might change by the start of July. A win streak here or a loss streak there could make or break the season, so while there are still plenty of games left to play, Milwaukee doesn’t have much room for error. View full article
 -
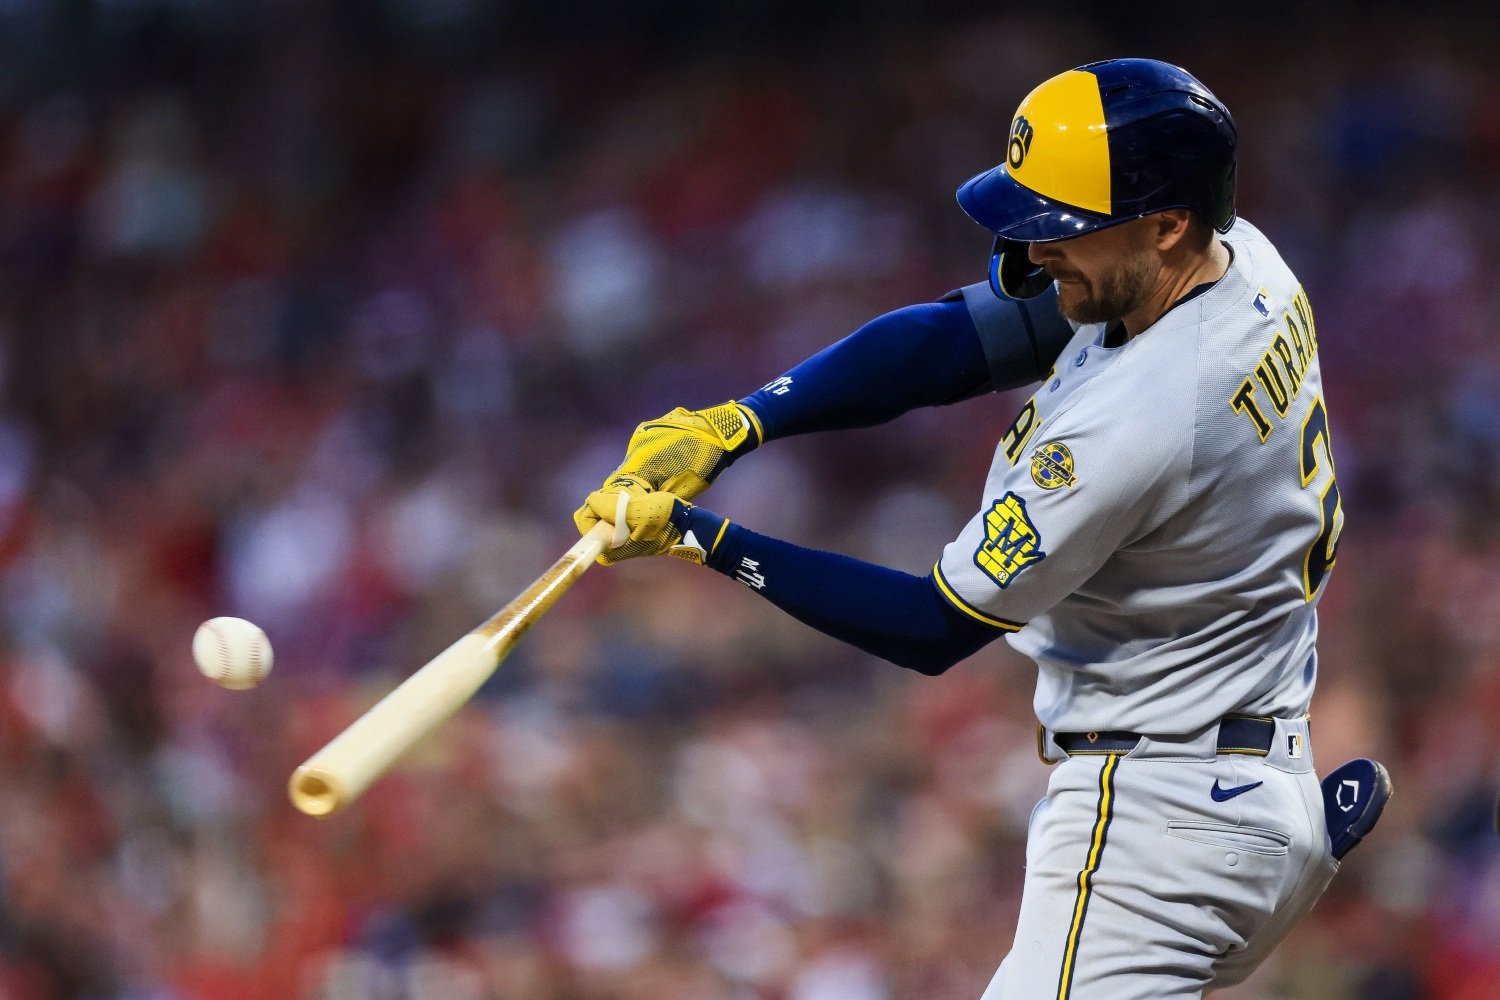 After more than 1,300 plate appearances, you should more or less know what you’re getting out of Brice Turang. He’s an outstanding middle infield defender with lackluster numbers at the plate. He almost changed our mind on his offensive capabilities last year, posting a .731 OPS in the first half, but by the end of the season, his numbers regressed to an 87 wRC+. This year, he’s off to another great start—but are his improved numbers a sign of a new leaf being turned, or just another first half tease? The thing that has hamstrung his offensive production since he debuted has been his lack of pop. He has never slugged better than .350 over a full season, and his quality of contact numbers for his first two major-league seasons were comfortably in the bottom quartile of qualified hitters. This year, it seems to be more of the same. His current ISO of .086 is the 12th-lowest in MLB and is right in line with his career average. Without power in today’s game, it’s difficult to be productive at the plate. This, then, begs the question: why is Turang just one of two players to have an ISO .090 or lower and a wRC+ above 100? To be fair, his wRC+ of 103 is just barely above the league-average threshold of 100, but it still deserves a closer look. His relatively high batting average (.270) and on-base percentage (.350) give him a boost, but is this the new norm or simply the result of luck on batted balls? His .337 batting average on balls in play seems to point us toward the latter, especially since people often use BABIP as a proxy for luck and offensive sustainability. But things are rarely that simple in the sport of baseball. If we instead look at his expected batting average (xBA), a metric that’s based on intrinsic characteristics like launch angle and exit velocity on batted balls, we see that it actually rates Turang as slightly unlucky, giving him a slightly higher mark of .279. To go even deeper, his expected slugging average (xSLG) of .421 makes it even more convincing: he's hitting into tough luck. But that wouldn’t (and shouldn’t) be enough to convince you that he has been swinging a better bat. You see, expected stats aren’t perfect, either. They don’t take into account horizontal launch angle, and the scale by which individual batted balls are granted a batting average is hazy at best. So, let's take a closer look at some more metrics to see if they've moved in the right direction. If you’re a Turang truther like me, you’ll be happy to know that his average exit velocity this season of 91.4 mph is in the top quartile and is miles better (haha, get it? 'cause mph) than last year’s mark of 87.0. All of his quality of contact numbers have taken big steps forward, thanks in large part to a 3-mph increase in his bat speed. Perhaps the Flintstones vitamins I sent him in the mail this offseason finally arrived. So if he’s hitting the ball harder than ever before, why are his ISO and SLG numbers still so disappointing? Well, first, it’s important to acknowledge that while they’re often used as a proxy for power, those metrics don’t translate perfectly. They’re based on a player’s ability to convert batted balls into extra-base hits, often doubles and homers, which require both power and lift to achieve. Unfortunately, Turang’s fly ball rate is below-average. Even more concerning is that he pulls just 3.9% of his batted balls in the air, dramatically limiting the distance he can achieve. In fact, he pulls the ball just 21.7% of the time, significantly lower than the league-average mark of 37.2%. It's pretty tough to be a power hitter when you hit the opposite way 36.7% of the time. Despite this quirk in his approach, though, he has still found a way to make it work thus far in 2025 and it’s clear that he’s closer to a true offensive breakout than he is to repeating the .585 OPS he had during his rookie year. But the best part is that any production he gets out of his bat is just a cherry on top of his primary value, which is on the basepaths and with his glove. He isn’t swiping bags at the same torrid pace as he did last year, but he still has 15 stolen bases, seventh in the National League. He also has six Defensive Runs Saved, more than any second baseman in MLB other than Nico Hoerner (10). Compounded with the fact that offensive expectations for second basemen are generally lower to begin with, it should be no surprise that Turang has been worth 2.6 rWAR so far this year, comfortably more than any other player on the Brewers. So yes, it’s true that after almost 70 games, he has just eight doubles and four homers. It’s also true that the peripherals are just waiting for him to pull a few balls in the air so his actual statistics can reflect what true Brewers fans have known since 2023: that Brice Turang is a talented and potentially helpful hitter.
 -
Image courtesy of © Katie Stratman-Imagn Images After more than 1,300 plate appearances, you should more or less know what you’re getting out of Brice Turang. He’s an outstanding middle infield defender with lackluster numbers at the plate. He almost changed our mind on his offensive capabilities last year, posting a .731 OPS in the first half, but by the end of the season, his numbers regressed to an 87 wRC+. This year, he’s off to another great start—but are his improved numbers a sign of a new leaf being turned, or just another first half tease? The thing that has hamstrung his offensive production since he debuted has been his lack of pop. He has never slugged better than .350 over a full season, and his quality of contact numbers for his first two major-league seasons were comfortably in the bottom quartile of qualified hitters. This year, it seems to be more of the same. His current ISO of .086 is the 12th-lowest in MLB and is right in line with his career average. Without power in today’s game, it’s difficult to be productive at the plate. This, then, begs the question: why is Turang just one of two players to have an ISO .090 or lower and a wRC+ above 100? To be fair, his wRC+ of 103 is just barely above the league-average threshold of 100, but it still deserves a closer look. His relatively high batting average (.270) and on-base percentage (.350) give him a boost, but is this the new norm or simply the result of luck on batted balls? His .337 batting average on balls in play seems to point us toward the latter, especially since people often use BABIP as a proxy for luck and offensive sustainability. But things are rarely that simple in the sport of baseball. If we instead look at his expected batting average (xBA), a metric that’s based on intrinsic characteristics like launch angle and exit velocity on batted balls, we see that it actually rates Turang as slightly unlucky, giving him a slightly higher mark of .279. To go even deeper, his expected slugging average (xSLG) of .421 makes it even more convincing: he's hitting into tough luck. But that wouldn’t (and shouldn’t) be enough to convince you that he has been swinging a better bat. You see, expected stats aren’t perfect, either. They don’t take into account horizontal launch angle, and the scale by which individual batted balls are granted a batting average is hazy at best. So, let's take a closer look at some more metrics to see if they've moved in the right direction. If you’re a Turang truther like me, you’ll be happy to know that his average exit velocity this season of 91.4 mph is in the top quartile and is miles better (haha, get it? 'cause mph) than last year’s mark of 87.0. All of his quality of contact numbers have taken big steps forward, thanks in large part to a 3-mph increase in his bat speed. Perhaps the Flintstones vitamins I sent him in the mail this offseason finally arrived. So if he’s hitting the ball harder than ever before, why are his ISO and SLG numbers still so disappointing? Well, first, it’s important to acknowledge that while they’re often used as a proxy for power, those metrics don’t translate perfectly. They’re based on a player’s ability to convert batted balls into extra-base hits, often doubles and homers, which require both power and lift to achieve. Unfortunately, Turang’s fly ball rate is below-average. Even more concerning is that he pulls just 3.9% of his batted balls in the air, dramatically limiting the distance he can achieve. In fact, he pulls the ball just 21.7% of the time, significantly lower than the league-average mark of 37.2%. It's pretty tough to be a power hitter when you hit the opposite way 36.7% of the time. Despite this quirk in his approach, though, he has still found a way to make it work thus far in 2025 and it’s clear that he’s closer to a true offensive breakout than he is to repeating the .585 OPS he had during his rookie year. But the best part is that any production he gets out of his bat is just a cherry on top of his primary value, which is on the basepaths and with his glove. He isn’t swiping bags at the same torrid pace as he did last year, but he still has 15 stolen bases, seventh in the National League. He also has six Defensive Runs Saved, more than any second baseman in MLB other than Nico Hoerner (10). Compounded with the fact that offensive expectations for second basemen are generally lower to begin with, it should be no surprise that Turang has been worth 2.6 rWAR so far this year, comfortably more than any other player on the Brewers. So yes, it’s true that after almost 70 games, he has just eight doubles and four homers. It’s also true that the peripherals are just waiting for him to pull a few balls in the air so his actual statistics can reflect what true Brewers fans have known since 2023: that Brice Turang is a talented and potentially helpful hitter. View full article
-
Image courtesy of Thiéres Rabelo Honorable Mentions Trevor Megill 11 G, 10 IP, 0.90 ERA, 6 H, 1 ER, 6 BB, 9 K, 1.20 WHIP, 7 SV Megill’s numbers didn’t look great to start the season after he gave up three earned runs on April 12 against the Diamondbacks. However, after his ERA ballooned to 5.79 as a result of that outing, he has locked back in, conceding just two runs since—only one of which was in May. He's lowered his ERA to 2.21 for the season. He has his knuckle curve to thank for much of his success. Opposing hitters are whiffing against it 59.2% of the time and it’s three times more valuable than his four-seam fastball on a run value per 100 pitches basis. He hasn’t blown a save opportunity since that aforementioned contest in mid-April, so here’s hoping he continues to be the latest closer success story in Milwaukee. Statistical Nugget: Megill has held opposing batters to a .496 OPS over 38 plate appearances with runners in scoring position. Logan Henderson 3 GS, 15 IP, 1.80 ERA, 11 H, 3 ER, 5 BB, 20 K, 1.07 WHIP Despite being recently optioned to clear room for DL Hall’s return, Henderson pitched extremely well in his three outings. With injuries plaguing the big league rotation, his handful of starts were a helpful stopgap that held down the fort while some of Milwaukee’s arms did their best to recover. Including his debut on April 20, Henderson has a 1.71 ERA over four starts this season—solid numbers for a rookie campaign. Some of his numbers were clearly due for regression, especially his 35.8% strikeout rate, but he was remarkably effective for someone with an average fastball velocity of just 93.0 mph. His arsenal is lacking development and depth, with his four-seam fastball and changeup accounting for 88.6% of his total pitches thrown, but with more time, he could be an outstanding under-the-radar part of the team’s rotation. Statistical Nugget: Henderson has held opposing hitters to a .101 OPS after reaching a 1-1 count. Freddy Peralta 5 GS, 25 ⅔ IP, 3.16 ERA, 22 H, 9 ER, 12 BB, 25 K, 1.32 WHIP Peralta has been throwing the ball this year. Even though his ERA was slightly higher in May than it was in April, it was still a solid number, and has helped him retain his spot as the most valuable member on the team by rWAR (1.7). There was a little more traffic on the basepaths than he probably would have liked, but he was able to minimize trouble to a reasonable degree. The notable changes to his arsenal are likely at least one of the reasons for his performance improvements over last year. He has seemingly ditched his slider altogether, and while he started off with a very effective curveball, his changeup has been the star of the show, holding opposing hitters to a .180 batting average, .000 ISO, and boasting a 36.4% whiff rate. Statistical Nugget: When facing the lineup for a third time, Peralta has limited opposing hitters to a .517 OPS, a lower number than the first (.649 OPS) and second (.643 OPS) times through the order. Pitcher of the Month - Chad Patrick 7 GS, 38 IP, 3.32 ERA, 36 H, 14 ER, 7 BB, 35 K, 1.13 WHIP In an outstanding effort by the rookie, Patrick led the Brewers in innings pitched by a comfortable margin, while also putting up strong numbers. He may not get the same Rookie of the Year attention as guys like Drake Baldwin, but don’t let that fool you: he is having a great year. He currently has a 2.97 ERA over the 63 ⅔ innings he has thrown. Although he has the ability to dial it up to the mid-90s if he so chooses, his most valuable weapon is by far his cutter, which has averaged just 87.5 mph. His stuff isn’t particularly dominant and his strikeout rate of just 21.6% is right about average, but the cutter has made it quite difficult for hitters to square up his pitches. Some 36% of his batted balls are classified as “under” by Statcast, meaning hitters are hitting lots of lazy flies and pop-ups on it. I’d hate to speak too soon and jinx it but so far, he seems like another top-notch rookie arm talent developed by the Brewers. Statistical Nugget: Patrick has a chase contact rate of 72.1%, nearly 15% higher than average. View full article
-
 Honorable Mentions Trevor Megill 11 G, 10 IP, 0.90 ERA, 6 H, 1 ER, 6 BB, 9 K, 1.20 WHIP, 7 SV Megill’s numbers didn’t look great to start the season after he gave up three earned runs on April 12 against the Diamondbacks. However, after his ERA ballooned to 5.79 as a result of that outing, he has locked back in, conceding just two runs since—only one of which was in May. He's lowered his ERA to 2.21 for the season. He has his knuckle curve to thank for much of his success. Opposing hitters are whiffing against it 59.2% of the time and it’s three times more valuable than his four-seam fastball on a run value per 100 pitches basis. He hasn’t blown a save opportunity since that aforementioned contest in mid-April, so here’s hoping he continues to be the latest closer success story in Milwaukee. Statistical Nugget: Megill has held opposing batters to a .496 OPS over 38 plate appearances with runners in scoring position. Logan Henderson 3 GS, 15 IP, 1.80 ERA, 11 H, 3 ER, 5 BB, 20 K, 1.07 WHIP Despite being recently optioned to clear room for DL Hall’s return, Henderson pitched extremely well in his three outings. With injuries plaguing the big league rotation, his handful of starts were a helpful stopgap that held down the fort while some of Milwaukee’s arms did their best to recover. Including his debut on April 20, Henderson has a 1.71 ERA over four starts this season—solid numbers for a rookie campaign. Some of his numbers were clearly due for regression, especially his 35.8% strikeout rate, but he was remarkably effective for someone with an average fastball velocity of just 93.0 mph. His arsenal is lacking development and depth, with his four-seam fastball and changeup accounting for 88.6% of his total pitches thrown, but with more time, he could be an outstanding under-the-radar part of the team’s rotation. Statistical Nugget: Henderson has held opposing hitters to a .101 OPS after reaching a 1-1 count. Freddy Peralta 5 GS, 25 ⅔ IP, 3.16 ERA, 22 H, 9 ER, 12 BB, 25 K, 1.32 WHIP Peralta has been throwing the ball this year. Even though his ERA was slightly higher in May than it was in April, it was still a solid number, and has helped him retain his spot as the most valuable member on the team by rWAR (1.7). There was a little more traffic on the basepaths than he probably would have liked, but he was able to minimize trouble to a reasonable degree. The notable changes to his arsenal are likely at least one of the reasons for his performance improvements over last year. He has seemingly ditched his slider altogether, and while he started off with a very effective curveball, his changeup has been the star of the show, holding opposing hitters to a .180 batting average, .000 ISO, and boasting a 36.4% whiff rate. Statistical Nugget: When facing the lineup for a third time, Peralta has limited opposing hitters to a .517 OPS, a lower number than the first (.649 OPS) and second (.643 OPS) times through the order. Pitcher of the Month - Chad Patrick 7 GS, 38 IP, 3.32 ERA, 36 H, 14 ER, 7 BB, 35 K, 1.13 WHIP In an outstanding effort by the rookie, Patrick led the Brewers in innings pitched by a comfortable margin, while also putting up strong numbers. He may not get the same Rookie of the Year attention as guys like Drake Baldwin, but don’t let that fool you: he is having a great year. He currently has a 2.97 ERA over the 63 ⅔ innings he has thrown. Although he has the ability to dial it up to the mid-90s if he so chooses, his most valuable weapon is by far his cutter, which has averaged just 87.5 mph. His stuff isn’t particularly dominant and his strikeout rate of just 21.6% is right about average, but the cutter has made it quite difficult for hitters to square up his pitches. Some 36% of his batted balls are classified as “under” by Statcast, meaning hitters are hitting lots of lazy flies and pop-ups on it. I’d hate to speak too soon and jinx it but so far, he seems like another top-notch rookie arm talent developed by the Brewers. Statistical Nugget: Patrick has a chase contact rate of 72.1%, nearly 15% higher than average.
 -
Honorable Mentions Jake Bauers 42 AB, .262/.367/.452, 11 H, 2 2B, 2 HR, 6 RBI, 7 BB, 3 SB The best bench player in baseball continued his strong season by being extremely productive when he did get a chance at playing time. Despite appearing in just 35 games so far, his rWAR for the season (0.4) is already the most he has accumulated since his rookie campaign in 2018. Given the pace he’s on at the moment, he’s set to surpass it in far fewer plate appearances. If we saw Bauers over a full sample of 600 or more plate appearances, we’d probably see his numbers come down, but given the current depth in the lineup, his limited use seems to fit the team’s needs perfectly. Eighty-one of his 92 plate appearances have come against right-handed pitching, and for a platoon player, a 127 OPS+ isn’t too shabby. Statistical Nugget: Bauers has a 1.119 OPS over 50 plate appearances with men on base. Christian Yelich 106 AB, .245/.292/.462, 26 H, 2 2B, 7 HR, 16 RBI, 6 BB, 4 SB It’s a shame that injuries derailed Yelich’s 2024, which was his best offensive season in years. It’s even more of a shame that 2025 has been a big step back, with his 105 OPS+ the worst mark since 2021. However, it does seem like things are moving in the right direction, most notably in the power department. With his 12 homers, he already has more than he had last year, and some of them have come in big moments. He still has a few things holding him back at the plate. First, his whiff and strikeout rates are both in the bottom quartile of qualified hitters. Second, his launch angle sweet spot rate of 24.5% places him in the 2nd percentile and his 63.3% ground ball rate is almost 20% higher than the league average. This past month, he also traded off plate discipline for more power, walking just six times, but he still has a respectable 10.2% walk rate for the year. Yelich's 1.047 OPS over the last two weeks is immensely encouraging, and could be a sign of meaningful improvements to his approach that will improve his results over the remainder of the season. Statistical Nugget: Yelich has a .577 OPS over 107 plate appearances at home and an .864 OPS over 135 plate appearances away. Hitter of the Month - Rhys Hoskins 96 AB, .271/.345/.531, 26 H, 7 2B, 6 HR, 22 RBI, 12 BB, 1 SB It’s a year late, but the Rhys Hoskins Brewers breakout is finally here. He’s been consistently good all year, but seems to be getting slightly hotter, posting an .866 OPS in April and an .877 OPS in May. The chase and walk rates are back to elite levels, giving him more strikes to hit and better conditions to lean on his talents as a slugger. It might be why his average exit velocity has jumped up almost 3 miles per hour since last year. First base went from the Brewers’ weakest position (.666 OPS, 25th in MLB) to one of their best (.878 OPS, 3rd in MLB), thanks to marked improvements from both Hoskins and Bauers. Unfortunately for Milwaukee, this is the final year on Hoskins’s contract, as his $18-million mutual contract option will likely get declined by someone once the offseason rolls around. If he keeps it up, he’ll likely look to net a bigger deal on the open market. If his numbers regress enough for him to exercise it, he likely wouldn’t be worth the salary to Milwaukee’s front office. So, enjoy the show while you can. By next year, he’ll probably be in a different uniform. Statistical Nugget: Hoskins has a .912 OPS over 64 plate appearances with runners in scoring position. View full article
-
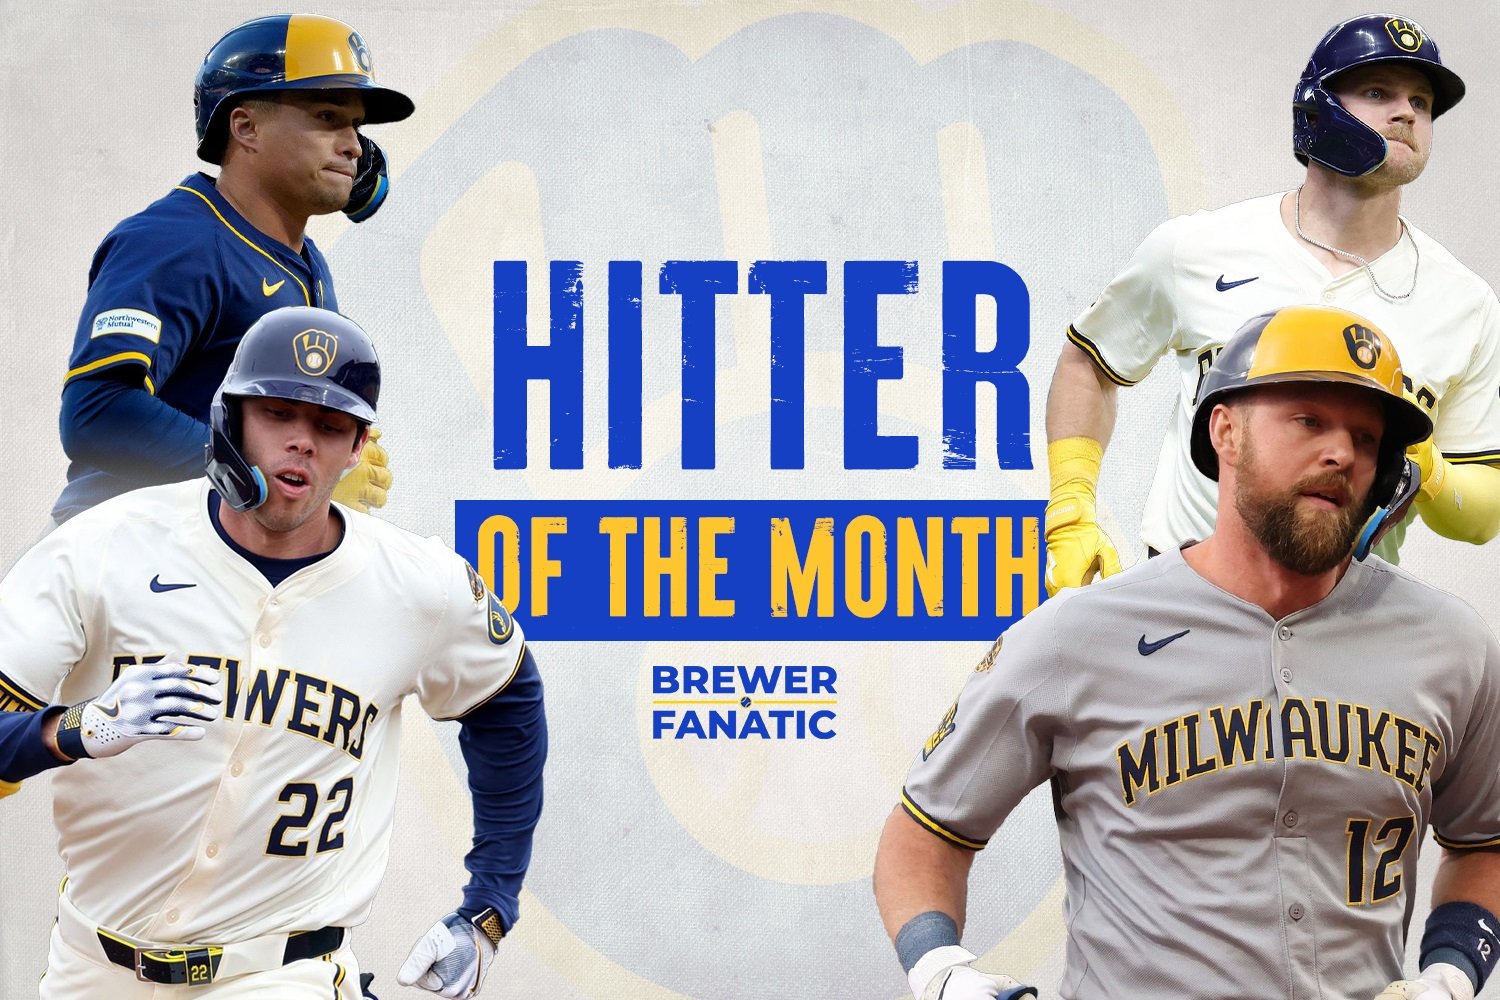 Honorable Mentions Jake Bauers 42 AB, .262/.367/.452, 11 H, 2 2B, 2 HR, 6 RBI, 7 BB, 3 SB The best bench player in baseball continued his strong season by being extremely productive when he did get a chance at playing time. Despite appearing in just 35 games so far, his rWAR for the season (0.4) is already the most he has accumulated since his rookie campaign in 2018. Given the pace he’s on at the moment, he’s set to surpass it in far fewer plate appearances. If we saw Bauers over a full sample of 600 or more plate appearances, we’d probably see his numbers come down, but given the current depth in the lineup, his limited use seems to fit the team’s needs perfectly. Eighty-one of his 92 plate appearances have come against right-handed pitching, and for a platoon player, a 127 OPS+ isn’t too shabby. Statistical Nugget: Bauers has a 1.119 OPS over 50 plate appearances with men on base. Christian Yelich 106 AB, .245/.292/.462, 26 H, 2 2B, 7 HR, 16 RBI, 6 BB, 4 SB It’s a shame that injuries derailed Yelich’s 2024, which was his best offensive season in years. It’s even more of a shame that 2025 has been a big step back, with his 105 OPS+ the worst mark since 2021. However, it does seem like things are moving in the right direction, most notably in the power department. With his 12 homers, he already has more than he had last year, and some of them have come in big moments. He still has a few things holding him back at the plate. First, his whiff and strikeout rates are both in the bottom quartile of qualified hitters. Second, his launch angle sweet spot rate of 24.5% places him in the 2nd percentile and his 63.3% ground ball rate is almost 20% higher than the league average. This past month, he also traded off plate discipline for more power, walking just six times, but he still has a respectable 10.2% walk rate for the year. Yelich's 1.047 OPS over the last two weeks is immensely encouraging, and could be a sign of meaningful improvements to his approach that will improve his results over the remainder of the season. Statistical Nugget: Yelich has a .577 OPS over 107 plate appearances at home and an .864 OPS over 135 plate appearances away. Hitter of the Month - Rhys Hoskins 96 AB, .271/.345/.531, 26 H, 7 2B, 6 HR, 22 RBI, 12 BB, 1 SB It’s a year late, but the Rhys Hoskins Brewers breakout is finally here. He’s been consistently good all year, but seems to be getting slightly hotter, posting an .866 OPS in April and an .877 OPS in May. The chase and walk rates are back to elite levels, giving him more strikes to hit and better conditions to lean on his talents as a slugger. It might be why his average exit velocity has jumped up almost 3 miles per hour since last year. First base went from the Brewers’ weakest position (.666 OPS, 25th in MLB) to one of their best (.878 OPS, 3rd in MLB), thanks to marked improvements from both Hoskins and Bauers. Unfortunately for Milwaukee, this is the final year on Hoskins’s contract, as his $18-million mutual contract option will likely get declined by someone once the offseason rolls around. If he keeps it up, he’ll likely look to net a bigger deal on the open market. If his numbers regress enough for him to exercise it, he likely wouldn’t be worth the salary to Milwaukee’s front office. So, enjoy the show while you can. By next year, he’ll probably be in a different uniform. Statistical Nugget: Hoskins has a .912 OPS over 64 plate appearances with runners in scoring position.
 -
Caleb Durbin Is Finding His Short King Swing
Jason Wang replied to Jason Wang's topic in Brewer Fanatic Front Page News
-
Image courtesy of © Patrick Gorski-Imagn Images Ever since he arrived in Milwaukee, Caleb Durbin’s player profile has been intriguing. A 14th-round pick out of Division 3 Washington University in St. Louis, making it in the sport of baseball has never been easy, given his relatively small stature. Now that he’s in the big leagues, the challenges have only just begun. One of his biggest struggles this year has been hitting the ball with authority, and it’s a topic that @Jack Stern dove into recently. Durbin must be a Brewer Fanatic lurker because since then, his numbers at the plate have taken a turn. In the last seven days (all stats listed are prior to Friday, May 30), he has slashed .308/.367/.462 with four doubles across 30 plate appearances. He’s also coming up in big moments, most recently walking off the Red Sox with a cool sacrifice fly. This all begs the question: Is he hitting the ball harder than usual, or is it just a small sample? It’s a good question, especially since the walk-off to center field was in shallow enough center to make the play at the plate exciting, even with a speedy Sal Frelick on third. Let’s use the publication date of Jack’s article, May 20th, as the cutoff for this analysis. A quick peek at average exit velocity before and after shows that he isn’t scorching balls any harder than he has been all year, averaging just 81-84 mph off the bat. However, generating power can mean much more than just measuring exit velocity. For example, it’s easy to see how a 120 mph batted ball straight into the dirt could be less valuable than a double to the corner at 95 mph. Furthermore, pulling the ball in the air can add even more distance for guys who don’t possess the natural pop. In Durbin’s case, pulling the ball has absolutely been a major contributor to his recent success. Of the five doubles he has logged across our nine-day sample, four were pulled. Just two of his ten total hits were to the opposite side. Of his 12 pulled balls in play, six had an exit velocity of 90 mph or above, a significant step up from his average exit velocity this season of just 84.2 mph. Another issue he has had all year has been his suboptimal launch angles. His launch angle sweet spot rate of 28.3% places him in the bottom decile of qualified hitters. His fly ball rate of 28.3% is nearly 5% higher than the league average, and his pop-up rate of 14.2% is double the league average. This is further corroborated by his Statcast quality of contact data, which shows that 36.3% of his batted balls are considered “under,” meaning he’s hitting balls in the air but softly. After May 20th, it appears that Durbin began to level out his swing and maintained his launch angles within the sweet spot, between 8 and 32 degrees. At this point, we have enough data to assume that without Mark McGwire’s offseason program of milk and hard work, he’ll never be a home run hitter. He has never had a minor league season with more than ten home runs, but by pulling the ball more consistently and getting flatter launch angles than he currently does, he could still be an effective hitter. His average attack direction is already six degrees to the pull side, and he gets an ideal attack angle more than two-thirds of the time, meaning the swing is actually in decent shape. Even without the ability to rack up hard-hit doubles and home runs like his more physically imposing peers, Durbin has already shown that he can be a formidable force at the plate, even if over a small sample. By leaning into what he can improve in his quality of contact and getting his walk rate out of the bottom decile, he could end up being the third baseman the Brewers have been after for years. View full article
-
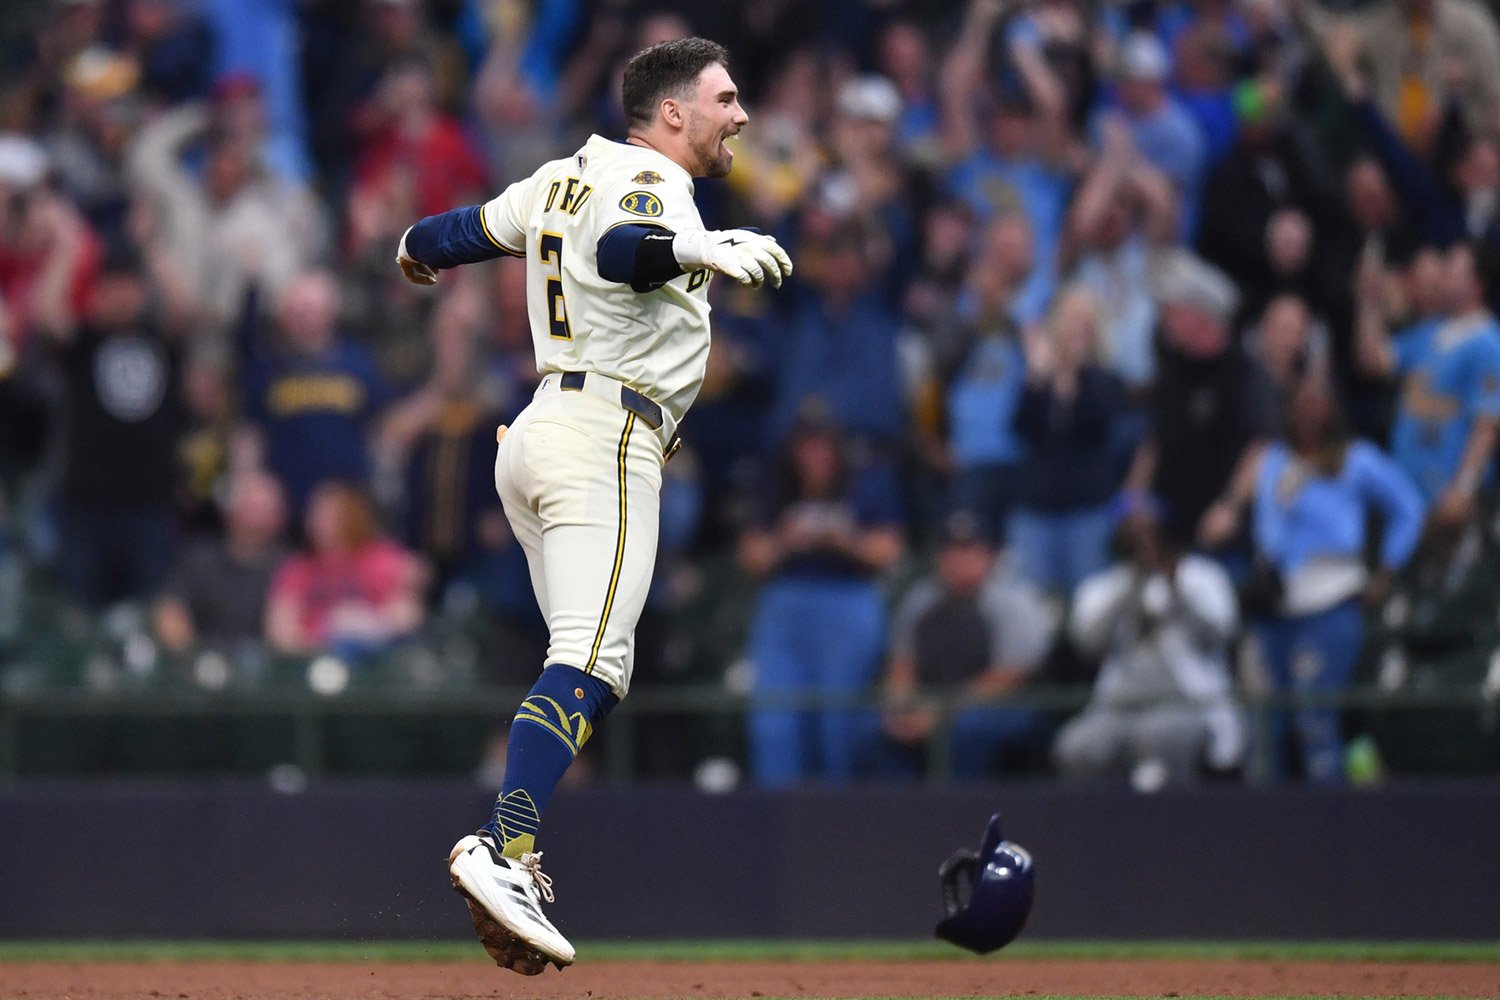 Ever since he arrived in Milwaukee, Caleb Durbin’s player profile has been intriguing. A 14th-round pick out of Division 3 Washington University in St. Louis, making it in the sport of baseball has never been easy, given his relatively small stature. Now that he’s in the big leagues, the challenges have only just begun. One of his biggest struggles this year has been hitting the ball with authority, and it’s a topic that @Jack Stern dove into recently. Durbin must be a Brewer Fanatic lurker because since then, his numbers at the plate have taken a turn. In the last seven days (all stats listed are prior to Friday, May 30), he has slashed .308/.367/.462 with four doubles across 30 plate appearances. He’s also coming up in big moments, most recently walking off the Red Sox with a cool sacrifice fly. This all begs the question: Is he hitting the ball harder than usual, or is it just a small sample? It’s a good question, especially since the walk-off to center field was in shallow enough center to make the play at the plate exciting, even with a speedy Sal Frelick on third. Let’s use the publication date of Jack’s article, May 20th, as the cutoff for this analysis. A quick peek at average exit velocity before and after shows that he isn’t scorching balls any harder than he has been all year, averaging just 81-84 mph off the bat. However, generating power can mean much more than just measuring exit velocity. For example, it’s easy to see how a 120 mph batted ball straight into the dirt could be less valuable than a double to the corner at 95 mph. Furthermore, pulling the ball in the air can add even more distance for guys who don’t possess the natural pop. In Durbin’s case, pulling the ball has absolutely been a major contributor to his recent success. Of the five doubles he has logged across our nine-day sample, four were pulled. Just two of his ten total hits were to the opposite side. Of his 12 pulled balls in play, six had an exit velocity of 90 mph or above, a significant step up from his average exit velocity this season of just 84.2 mph. Another issue he has had all year has been his suboptimal launch angles. His launch angle sweet spot rate of 28.3% places him in the bottom decile of qualified hitters. His fly ball rate of 28.3% is nearly 5% higher than the league average, and his pop-up rate of 14.2% is double the league average. This is further corroborated by his Statcast quality of contact data, which shows that 36.3% of his batted balls are considered “under,” meaning he’s hitting balls in the air but softly. After May 20th, it appears that Durbin began to level out his swing and maintained his launch angles within the sweet spot, between 8 and 32 degrees. At this point, we have enough data to assume that without Mark McGwire’s offseason program of milk and hard work, he’ll never be a home run hitter. He has never had a minor league season with more than ten home runs, but by pulling the ball more consistently and getting flatter launch angles than he currently does, he could still be an effective hitter. His average attack direction is already six degrees to the pull side, and he gets an ideal attack angle more than two-thirds of the time, meaning the swing is actually in decent shape. Even without the ability to rack up hard-hit doubles and home runs like his more physically imposing peers, Durbin has already shown that he can be a formidable force at the plate, even if over a small sample. By leaning into what he can improve in his quality of contact and getting his walk rate out of the bottom decile, he could end up being the third baseman the Brewers have been after for years.
 -
look i'll just state the obvious. jackson's 21st birthday was march 11th of this year. and he plays for the BREWers. he is probably just enjoying his first few legal IPAs. now that he realizes how terrible all alcohol tastes and returns to his steady diet of shirley temples and roy rogers he will become the prospect we have been waiting for.
-
Episode 54: Signs Of Life
Jason Wang replied to Spencer Michaelis's topic in Brewer Fanatic Front Page News
it's okay brian i too am an ikf truther -
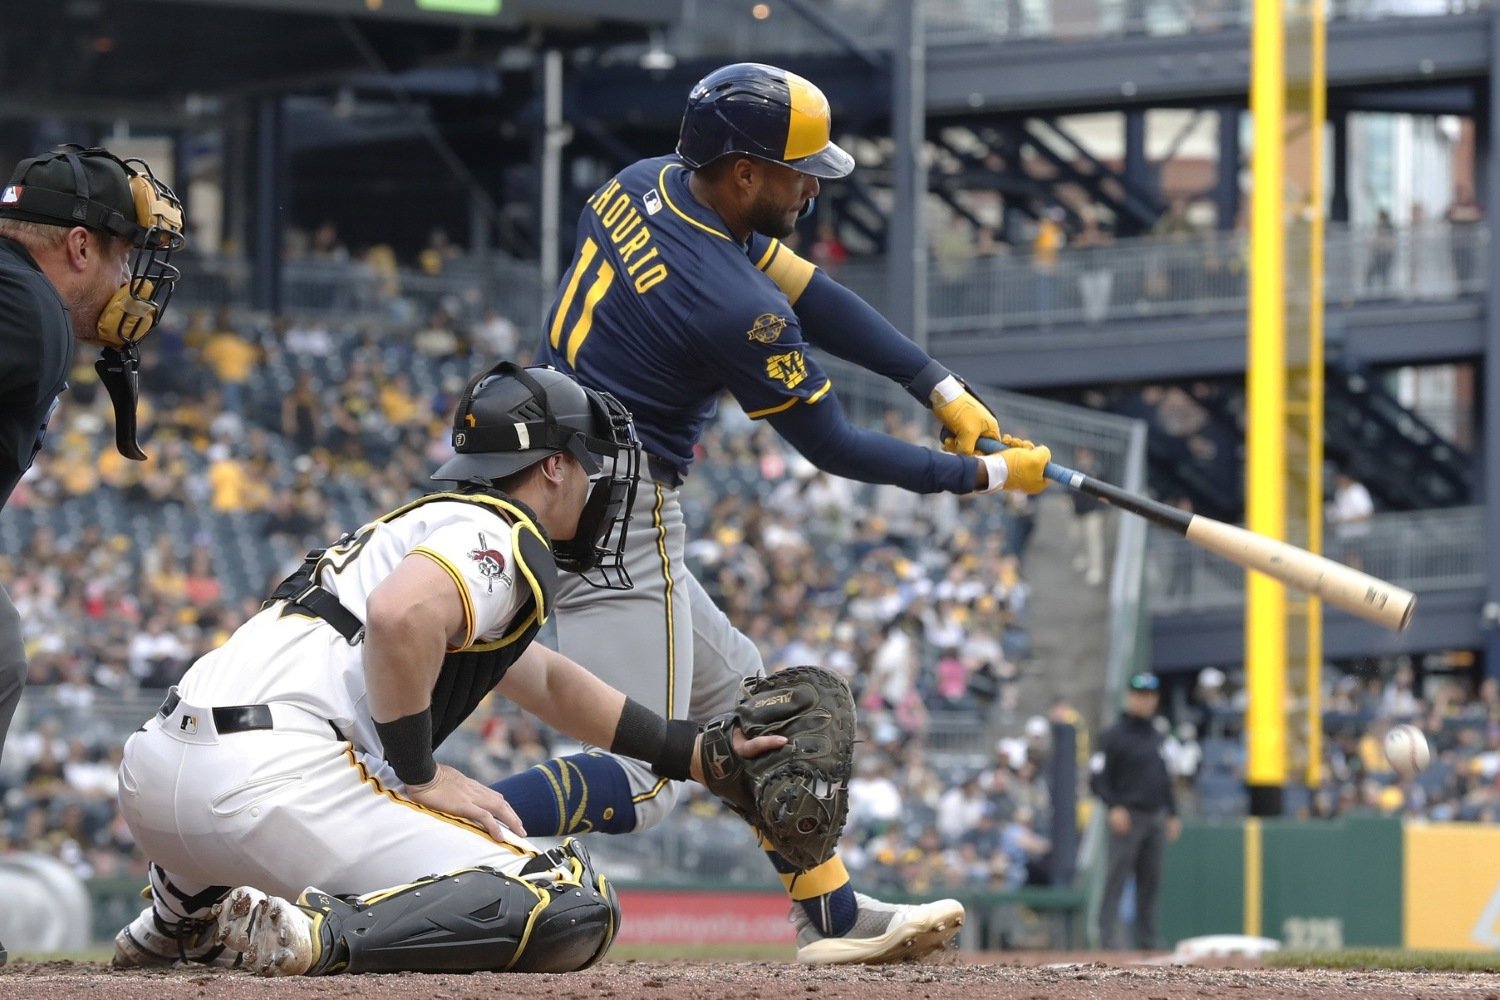 A year ago, MLB introduced a new set of metrics to Statcast that all had something in common: they attempted to quantify the characteristics of every player’s swing. For the first time, even the most casual of baseball fans could look at anyone’s bat speed, fast-swing rate, squared-up rate, number of “blasts,” and swing length. Following the success of that information being made public, MLB turned up the complexity a notch by adding four more metrics that are even more complex: swing path, attack angle, ideal attack angle rate, and attack direction. This added complexity is cool and can be a neat way to impress your coworkers at the water cooler, but only if you really know what each metric means and how to interpret it. So, let’s walk through what’s being measured for each example. Swing Path One of the most notable differences between a golf and a baseball swing is the amount of tilt on the swing. In golf, swings are much steeper, for several reasons (like the fact that the ball is sitting still) which would give the swing greater tilt. In baseball, I’m sure you have great memories of a parent or coach telling you to “level out” your swing in hopes that you’d create a flatter bat path, with lower tilt. To measure this for big leaguers, MLB calculates the angle of the swing in the final 0.4 seconds prior to contact. The MLB average is right around 32°, but some players are more extreme than others, with average tilt ranging from roughly 23˜ to 46°. The Brewers must not have a lot of golfers on the club, because for the most part, their players are right around the league-average tilt on their swings. The flattest bat path goes to Jackson Chourio, who has an average swing path tilt of 26 degrees. While a good high-level glimpse of a player’s approach, it’s an incomplete measurement. First, swings vary immensely depending on where a given pitch is landing. Second, both ends of the swing path spectrum have their pros and cons. Flatter paths help with making contact, but limit the amount of power one can generate. Steeper paths are the opposite. So, like a fantasy football draft, it’s best to be somewhere in the middle. Attack Angle The attack angle measures the second part of the swing. While swing path takes into account the arc of the swing, attack angle only measures the vertical angle of the bat right when it hits the ball. This gives us an idea of where in a given hitter’s swing they typically make contact with the ball. Negative attack angles mean that the player is still swinging down when they hit the ball, whereas a positive attack angle means the player is already in the latter half of their swing. This can also be interpreted as a timing mechanism. If one is late, their attack angle will typically be lower. If one is early, their attack angle will typically be more steep. Joey Ortiz has an average attack angle of just 3°, quite a bit below the league average of 10°. Like swing path, using a single average number isn’t necessarily the best way to get an accurate look at what a player’s swing looks like, since it may vary widely pitch by pitch, but a very flat average attack angle could be a big reason why Ortiz is struggling to find any semblance of power this year, slugging just .252 over 175 plate appearances. In fact, @Jake McKibbin suggested as much in his recent piece diagnosing a root cause for Ortiz’s deflated offensive performance. Ideal Attack Angle Percentage With thousands of swings registered in their database, it didn’t take long for MLB to find that the most productive contact typically happens at attack angles between 5° and 20°. This should make sense, since that’s the angle at which most pitches hit the strike zone, allowing hitters to match the plane most closely with their barrels. As stated earlier, a single average metric isn’t necessarily a great way to determine how a player attacks pitches, since each individual example can vary wildly. However, a look at how often they’re attacking the ball at a theoretically optimal angle should give you a clearer idea of how well their swing is working. Of course, like launch angle, being in the ideal range can still be hamstrung by a lack of bat speed. Caleb Durbin finds the ideal attack angle roughly 67% of the time but his overall production is held back by bottom percentile exit velocity and bat speed. Attack Direction The simplest way to think of attack direction is as the horizontal version of attack angle. It measures the horizontal angle of the bat at the point of contact and, like attack angle, can be used to gauge timing. Earlier hitters will have greater angles to the pull side and later hitters will have the opposite. While it’s generally better to pull the ball because it provides one with access to more power, there are players who find success going the other way as well. Pitch height also creates variability in attack direction for swings, but that's mostly because higher velocity works best when it's at the top of the zone, while non-fastball pitches work best lower in the zone. Given that higher velocity makes catching up a little harder, it makes sense that one might see more pull-oriented swings against lower pitches and more opposite attack directions at the upper parts of the zone. Interestingly, Milwaukee’s own Brice Turang currently has the most opposite field-oriented swing in MLB, averaging a horizontal attack angle of 11° going the other way. This matches up with his current positive run value against almost all breaking and off-speed pitches, while he has struggled immensely against fastballs. Rhys Hoskins leads qualified hitters on the team with an attack direction of 6° to the pull side, which could be why he also leads the lineup with a .478 slugging percentage. It should be no surprise that he has crushed fastballs but has struggled more against pitches with movement, the sweeper in particular. Unlike more traditional metrics like strikeout rate and chase rate, there isn’t a clear “better” or “worse” place to be for these new metrics. It may be preferable to have a more pull-oriented attack direction or hit the ideal attack angle more frequently but it’s far less cut and dry than the simpler measurements. All of this helps break down the nitty gritty details of what a player looks like at the plate and come to a potential diagnosis of what could be the cause of their hot streak or cold stretch. The best part of all this is that if you're more of an "eye test" fan who believes numbers and high-tech equipment are sullying the national pastime, then you can always feel free to ignore all of this shiny new information. On the other hand, if you find this sort of stuff interesting, MLB seems intent on adding as much data as possible to bring fans closer to the game so there will likely be more information to come. Comprehending the more complex stuff is the hard part but once you get an idea of what it measures and how to interpret it, it can become an integral piece of your own analysis. Either way, whether you're checking swing speeds and attack angles or just happy to enjoy beers and brats at the ol' ballpark, you're a fan of the game.
 -
Image courtesy of © Charles LeClaire-Imagn Images A year ago, MLB introduced a new set of metrics to Statcast that all had something in common: they attempted to quantify the characteristics of every player’s swing. For the first time, even the most casual of baseball fans could look at anyone’s bat speed, fast-swing rate, squared-up rate, number of “blasts,” and swing length. Following the success of that information being made public, MLB turned up the complexity a notch by adding four more metrics that are even more complex: swing path, attack angle, ideal attack angle rate, and attack direction. This added complexity is cool and can be a neat way to impress your coworkers at the water cooler, but only if you really know what each metric means and how to interpret it. So, let’s walk through what’s being measured for each example. Swing Path One of the most notable differences between a golf and a baseball swing is the amount of tilt on the swing. In golf, swings are much steeper, for several reasons (like the fact that the ball is sitting still) which would give the swing greater tilt. In baseball, I’m sure you have great memories of a parent or coach telling you to “level out” your swing in hopes that you’d create a flatter bat path, with lower tilt. To measure this for big leaguers, MLB calculates the angle of the swing in the final 0.4 seconds prior to contact. The MLB average is right around 32°, but some players are more extreme than others, with average tilt ranging from roughly 23˜ to 46°. The Brewers must not have a lot of golfers on the club, because for the most part, their players are right around the league-average tilt on their swings. The flattest bat path goes to Jackson Chourio, who has an average swing path tilt of 26 degrees. While a good high-level glimpse of a player’s approach, it’s an incomplete measurement. First, swings vary immensely depending on where a given pitch is landing. Second, both ends of the swing path spectrum have their pros and cons. Flatter paths help with making contact, but limit the amount of power one can generate. Steeper paths are the opposite. So, like a fantasy football draft, it’s best to be somewhere in the middle. Attack Angle The attack angle measures the second part of the swing. While swing path takes into account the arc of the swing, attack angle only measures the vertical angle of the bat right when it hits the ball. This gives us an idea of where in a given hitter’s swing they typically make contact with the ball. Negative attack angles mean that the player is still swinging down when they hit the ball, whereas a positive attack angle means the player is already in the latter half of their swing. This can also be interpreted as a timing mechanism. If one is late, their attack angle will typically be lower. If one is early, their attack angle will typically be more steep. Joey Ortiz has an average attack angle of just 3°, quite a bit below the league average of 10°. Like swing path, using a single average number isn’t necessarily the best way to get an accurate look at what a player’s swing looks like, since it may vary widely pitch by pitch, but a very flat average attack angle could be a big reason why Ortiz is struggling to find any semblance of power this year, slugging just .252 over 175 plate appearances. In fact, @Jake McKibbin suggested as much in his recent piece diagnosing a root cause for Ortiz’s deflated offensive performance. Ideal Attack Angle Percentage With thousands of swings registered in their database, it didn’t take long for MLB to find that the most productive contact typically happens at attack angles between 5° and 20°. This should make sense, since that’s the angle at which most pitches hit the strike zone, allowing hitters to match the plane most closely with their barrels. As stated earlier, a single average metric isn’t necessarily a great way to determine how a player attacks pitches, since each individual example can vary wildly. However, a look at how often they’re attacking the ball at a theoretically optimal angle should give you a clearer idea of how well their swing is working. Of course, like launch angle, being in the ideal range can still be hamstrung by a lack of bat speed. Caleb Durbin finds the ideal attack angle roughly 67% of the time but his overall production is held back by bottom percentile exit velocity and bat speed. Attack Direction The simplest way to think of attack direction is as the horizontal version of attack angle. It measures the horizontal angle of the bat at the point of contact and, like attack angle, can be used to gauge timing. Earlier hitters will have greater angles to the pull side and later hitters will have the opposite. While it’s generally better to pull the ball because it provides one with access to more power, there are players who find success going the other way as well. Pitch height also creates variability in attack direction for swings, but that's mostly because higher velocity works best when it's at the top of the zone, while non-fastball pitches work best lower in the zone. Given that higher velocity makes catching up a little harder, it makes sense that one might see more pull-oriented swings against lower pitches and more opposite attack directions at the upper parts of the zone. Interestingly, Milwaukee’s own Brice Turang currently has the most opposite field-oriented swing in MLB, averaging a horizontal attack angle of 11° going the other way. This matches up with his current positive run value against almost all breaking and off-speed pitches, while he has struggled immensely against fastballs. Rhys Hoskins leads qualified hitters on the team with an attack direction of 6° to the pull side, which could be why he also leads the lineup with a .478 slugging percentage. It should be no surprise that he has crushed fastballs but has struggled more against pitches with movement, the sweeper in particular. Unlike more traditional metrics like strikeout rate and chase rate, there isn’t a clear “better” or “worse” place to be for these new metrics. It may be preferable to have a more pull-oriented attack direction or hit the ideal attack angle more frequently but it’s far less cut and dry than the simpler measurements. All of this helps break down the nitty gritty details of what a player looks like at the plate and come to a potential diagnosis of what could be the cause of their hot streak or cold stretch. The best part of all this is that if you're more of an "eye test" fan who believes numbers and high-tech equipment are sullying the national pastime, then you can always feel free to ignore all of this shiny new information. On the other hand, if you find this sort of stuff interesting, MLB seems intent on adding as much data as possible to bring fans closer to the game so there will likely be more information to come. Comprehending the more complex stuff is the hard part but once you get an idea of what it measures and how to interpret it, it can become an integral piece of your own analysis. Either way, whether you're checking swing speeds and attack angles or just happy to enjoy beers and brats at the ol' ballpark, you're a fan of the game. View full article
-
- 1
-

-
the brewers are always one carlos santana away from making the postseason then getting bounced in the first round
-
yeah ski jumper falling sounds about right
-
:( I tried to add jokes to make it an easier read
- 6 replies
-
- 1
-
-
- brandon woodruff
- aaron ashby
- (and 5 more)
-
Image courtesy of © Wm. Glasheen/USA TODAY NETWORK-Wisconsin / USA TODAY NETWORK via Imagn Images If you’re a pessimistic fan, this season is already an abject disaster. There’s a decent amount of truth in that dour outlook, too. Milwaukee is two games below .500, six games behind the division-leading Cubs, and struggling to play competitive baseball. If you’re an optimistic fan, you might believe things can’t really get any worse from here—and there’s also truth to that. One of the biggest factors that has hamstrung this team is their litany of pitching injuries. It was already a plague that dragged the team down last season, but somehow, they found a way to cruise to the playoffs undaunted. This year, it seems to be hurting double. The silver lining is that muscles, tendons, and ligaments do eventually heal, so the Brewers should be getting back at least some of their arms to help give the team a fighting chance for the remainder of the year. Here’s a closer look at where each of their injured pitchers currently stands, and when we can expect them to return. Brandon Woodruff (shoulder surgery) Woodruff has been out of the game for what feels like forever and is on the cusp of returning to the Brewers rotation. Even his rehab process has taken quite some time, starting his first rehab assignment on April 12 and bouncing between Triple-A Nashville and High-A Wisconsin. He was originally expected to return sometime this month, but in yet another stroke of bad luck, endured another injury. He has made some adjustments to his pitching style, and despite a slight dip in velocity, he has put up great numbers in the minor leagues. He has a 2.25 ERA over 20 innings with the Sounds and a 2.70 ERA over 9 ⅔ innings with the Timber Rattlers. Given the newest issues with his ankle, it seems like the organization isn’t exactly rushing him to get back, but both he and the team are looking forward to seeing him return to action. Nestor Cortes (left elbow flexor strain) Cortes was only able to make two starts before hitting the shelf with elbow discomfort that arose during a bullpen. Originally placed on the 15-day IL, he was transferred to the 60-day IL on April 21. Recovery for these injuries is often slow, and although he resumed playing catch a few weeks ago, he won’t be back for a while. This flexor strain is the same issue that kept him out of much of the Yankees’ 2024 postseason run, and it’s unclear whether this instance of the injury is a re-aggravation of that or if it’s a separate case altogether. Brewers fans have already seen two versions of Cortes, and if he doesn’t return until around the start of the second half, he’ll only get a few starts to correct his reputation and statline. Jose Quintana (left shoulder impingement) Quitana was off to a great start with the Brewers, posting a 2.65 ERA over 34 innings, but felt some shoulder pain after his outing against the Rays on May 9. The severity of the injury is still a matter of some debate, but the team seems to believe that it isn’t as serious as it might sound. A relatively short IL stint is expected, and he threw a bullpen on May 20, with another session scheduled for Friday. Aaron Civale (left hamstring strain) Civale made it just three innings before being sidelined by injury. He was placed on the 15-day IL on March 31, and hasn’t toed a big-league mound since. Luckily, he began a rehab assignment with the Sounds on May 8, and has pitched nine scoreless innings across two outings. He was scheduled to make his final start of the assignment on Wednesday, but was a last-minute scratch. No reason for the change was made public, but given how good he has looked, there is a possibility that he’s returning to the big-league squad sooner than expected. The Brewers have yet to announce a starter for Thursday night's series opener in Pittsburgh. Aaron Ashby (right oblique strain) Ashby still hasn’t gotten a chance to pitch in the regular season this year, after suffering an oblique strain in spring training and a setback the first time attempted to return. He began his rehab assignment on May 6 with the ACL Brewers and started a more robust assignment with the sounds on May 10. He has pitched to a 1.50 ERA with a 1.33 WHIP over 6 Triple-A innings. When he does finally return to the major-league roster, it has been said that he’ll be used primarily as a long reliever, an apt role for a pitcher with his qualities. DL Hall (left lat strain) Hall is another pitcher who has seemingly met roadblock after roadblock. Because of persistent injuries, he has only pitched a total of seven starts and 43 innings as a Brewer since joining the team prior to the 2024 season. He was placed on the 60-day IL on March 5 and began his first rehab assignment of the year on May 2. He has looked good thus far, conceding no earned runs in his 10 ⅔ innings. Like Ashby, he’s slated to be a long reliever when he returns to the team, which should be soon after he’s first eligible to be activated from the IL in late May. Robert Gasser (Tommy John recovery) After a strong freshman campaign that saw him pitch to a 2.57 ERA over five starts, Gasser quickly ran into elbow trouble that required going under the knife. Given the typical timeline of Tommy John surgery, he probably won’t be able to return until much later in the season, potentially around September, and he has plenty of rehab and ramping up in front of him before he does. Connor Thomas (left elbow arthritis) How cursed are the Brewers when it comes to injuries? Well, how often do you hear of a 26-year-old with arthritis? April 8 was the first time I heard of it, after it caused Thomas to be placed on the 15-day IL. He was transferred to the 60-day IL on May 18th. He has received injections for his elbow, but there’s no clear timeline for his return. View full article
-
Milwaukee Brewers Pitching Injury Updates: Who’s Returning, and When?
Jason Wang posted an article in Brewers
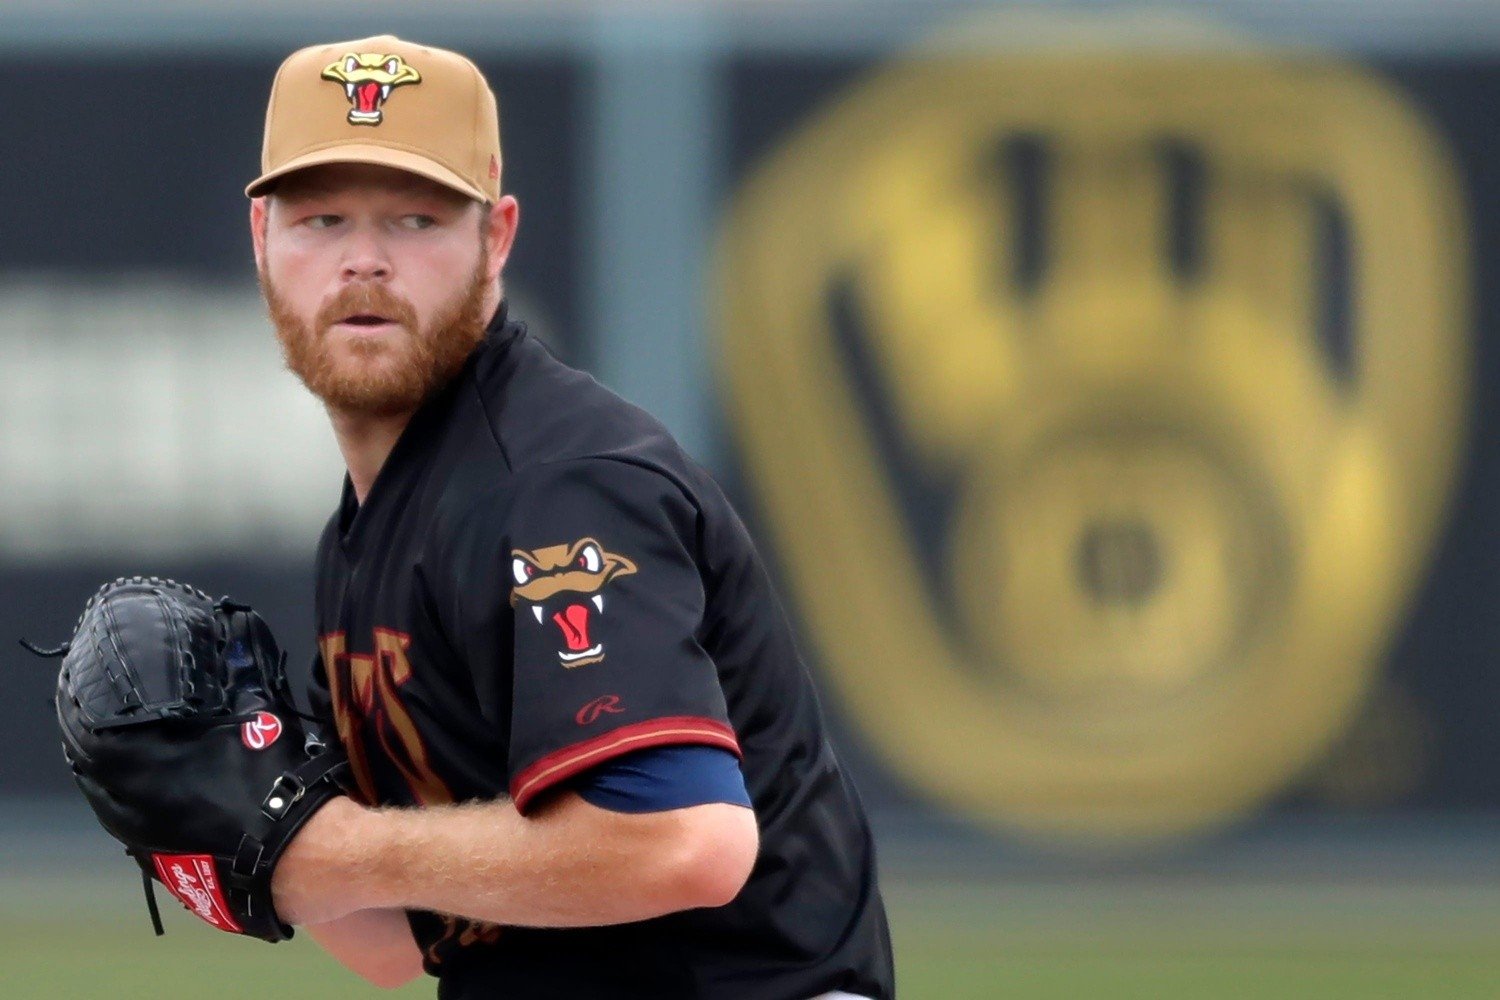 If you’re a pessimistic fan, this season is already an abject disaster. There’s a decent amount of truth in that dour outlook, too. Milwaukee is two games below .500, six games behind the division-leading Cubs, and struggling to play competitive baseball. If you’re an optimistic fan, you might believe things can’t really get any worse from here—and there’s also truth to that. One of the biggest factors that has hamstrung this team is their litany of pitching injuries. It was already a plague that dragged the team down last season, but somehow, they found a way to cruise to the playoffs undaunted. This year, it seems to be hurting double. The silver lining is that muscles, tendons, and ligaments do eventually heal, so the Brewers should be getting back at least some of their arms to help give the team a fighting chance for the remainder of the year. Here’s a closer look at where each of their injured pitchers currently stands, and when we can expect them to return. Brandon Woodruff (shoulder surgery) Woodruff has been out of the game for what feels like forever and is on the cusp of returning to the Brewers rotation. Even his rehab process has taken quite some time, starting his first rehab assignment on April 12 and bouncing between Triple-A Nashville and High-A Wisconsin. He was originally expected to return sometime this month, but in yet another stroke of bad luck, endured another injury. He has made some adjustments to his pitching style, and despite a slight dip in velocity, he has put up great numbers in the minor leagues. He has a 2.25 ERA over 20 innings with the Sounds and a 2.70 ERA over 9 ⅔ innings with the Timber Rattlers. Given the newest issues with his ankle, it seems like the organization isn’t exactly rushing him to get back, but both he and the team are looking forward to seeing him return to action. Nestor Cortes (left elbow flexor strain) Cortes was only able to make two starts before hitting the shelf with elbow discomfort that arose during a bullpen. Originally placed on the 15-day IL, he was transferred to the 60-day IL on April 21. Recovery for these injuries is often slow, and although he resumed playing catch a few weeks ago, he won’t be back for a while. This flexor strain is the same issue that kept him out of much of the Yankees’ 2024 postseason run, and it’s unclear whether this instance of the injury is a re-aggravation of that or if it’s a separate case altogether. Brewers fans have already seen two versions of Cortes, and if he doesn’t return until around the start of the second half, he’ll only get a few starts to correct his reputation and statline. Jose Quintana (left shoulder impingement) Quitana was off to a great start with the Brewers, posting a 2.65 ERA over 34 innings, but felt some shoulder pain after his outing against the Rays on May 9. The severity of the injury is still a matter of some debate, but the team seems to believe that it isn’t as serious as it might sound. A relatively short IL stint is expected, and he threw a bullpen on May 20, with another session scheduled for Friday. Aaron Civale (left hamstring strain) Civale made it just three innings before being sidelined by injury. He was placed on the 15-day IL on March 31, and hasn’t toed a big-league mound since. Luckily, he began a rehab assignment with the Sounds on May 8, and has pitched nine scoreless innings across two outings. He was scheduled to make his final start of the assignment on Wednesday, but was a last-minute scratch. No reason for the change was made public, but given how good he has looked, there is a possibility that he’s returning to the big-league squad sooner than expected. The Brewers have yet to announce a starter for Thursday night's series opener in Pittsburgh. Aaron Ashby (right oblique strain) Ashby still hasn’t gotten a chance to pitch in the regular season this year, after suffering an oblique strain in spring training and a setback the first time attempted to return. He began his rehab assignment on May 6 with the ACL Brewers and started a more robust assignment with the sounds on May 10. He has pitched to a 1.50 ERA with a 1.33 WHIP over 6 Triple-A innings. When he does finally return to the major-league roster, it has been said that he’ll be used primarily as a long reliever, an apt role for a pitcher with his qualities. DL Hall (left lat strain) Hall is another pitcher who has seemingly met roadblock after roadblock. Because of persistent injuries, he has only pitched a total of seven starts and 43 innings as a Brewer since joining the team prior to the 2024 season. He was placed on the 60-day IL on March 5 and began his first rehab assignment of the year on May 2. He has looked good thus far, conceding no earned runs in his 10 ⅔ innings. Like Ashby, he’s slated to be a long reliever when he returns to the team, which should be soon after he’s first eligible to be activated from the IL in late May. Robert Gasser (Tommy John recovery) After a strong freshman campaign that saw him pitch to a 2.57 ERA over five starts, Gasser quickly ran into elbow trouble that required going under the knife. Given the typical timeline of Tommy John surgery, he probably won’t be able to return until much later in the season, potentially around September, and he has plenty of rehab and ramping up in front of him before he does. Connor Thomas (left elbow arthritis) How cursed are the Brewers when it comes to injuries? Well, how often do you hear of a 26-year-old with arthritis? April 8 was the first time I heard of it, after it caused Thomas to be placed on the 15-day IL. He was transferred to the 60-day IL on May 18th. He has received injections for his elbow, but there’s no clear timeline for his return.
- 6 comments
-
- 2
-
-
- brandon woodruff
- aaron ashby
- (and 5 more)
-
what about julio teheran for that one month he was really good before he got really bad
-
opening an umbrella indoors
-
Image courtesy of © Benny Sieu-Imagn Images I’m a pretty optimistic guy. Every year, I place three small and separate wagers on Anthony Rendon, Kris Bryant, and José Abreu to win MVP awards. Of course, these bets must be placed with a somewhat shady, unofficial bookmaker, because no gambling platform worth their salt would allow someone to risk money on events with such astronomical odds. I persist in my dogged faith that one of those bets will eventually pay off. Despite my tendency to look on the bright side of life and remain in good spirits about most things, though, even I can say that the Milwaukee Brewers are probably not going to do much of anything this year. This has never been a perfect team, and the budget has rarely come close to eclipsing the league average, but David Stearns's and Matt Arnold’s uncanny abilities to build a winning roster out of a box of scraps has pushed the team to consistent success over the past several years. In 2025, that luck seems to have run out. It was another year of doing barely anything in the offseason, and outside of the Devin Williams trade, the most notable move on the Brewers’ list of transactions may have been Jared Koenig changing his number back to 47. What has been the result of this inaction? The Brewers’ lineup has combined for a .652 OPS, 28th in MLB and better than just the Pirates and White Sox—two teams you hardly want in your peer group. Only three players have more than 100 plate appearances and an wRC+ better than average, while the players who are struggling are doing so with gusto. William Contreras is putting up numbers far worse than his past two years with the team, playing through an injury. Jackson Chourio was making so many mistakes in his approach that he was bumped down in the lineup. In stark contrast with the scorching start he got off to last year, it seems that Christian Yelich’s back problems have returned as a significant impediment to his abilities. But perhaps no one has been as disappointing as Joey Ortiz, who has hit a brick wall after being moved back to his native role of shortstop. Willy Adames left big shoes to fill, but Ortiz initially seemed primed for the task. He had been a top prospect in a stacked Baltimore system, and while imperfect, his first year in Milwaukee was good, culminating in a 104 wRC+ and 3.1 fWAR. In 2025, his wRC+ sits at just 29, and he has been worse than replacement-level overall. Fellow Brewer Fanatic writer Jack Stern did a deeper dive on what might be going wrong (and how the team might address it) in this recent piece. It’s tricky to even skew the stats in a way that would give the lineup any sort of credit. Outside of leading the league in stolen bases, the offensive numbers are pretty lackluster across the board. Here is where they rank in several major hitting statistics compared to the other 29 MLB teams. BA .229 (25th) OBP .306 (22nd) SLG .346 28th R 193 (16th) H 347 (23rd) 2B 59 (25th) HR 37 (26th) SO 379 (16th) OPS vs. LHP .611 (25th) OPS vs. RHP .672 (25th) These problems are now more apparent than ever, with the Crew scoring in just one of their last five games. In fact, they’ve scored more than five runs in just 12 of their 46 contests thus far this season. Not only are they currently trying their best to avoid a sweep at the hands of the Twins, they’re trying to avoid being totally shut out for the entire weekend. Sometimes, a team can compensate for a lack of offense with stellar pitching and defense. The Seattle Mariners had a bottom-bucket offense last year, but their top-tier pitching and good defense carried them to being just a few wins short of a Wild Card spot. Unfortunately, the Brewers can’t really lean on that, either. While these two characteristics have been a strength of the roster in recent years, their combined ERA of 4.19 is 21st in MLB and they rank 16th in total Defensive Runs Saved, with 6. While the Cubs have maintained the strong pace they set to start the season and the Cardinals recently went on a nine-game winning streak, the Brewers have fallen further and further down the NL Central, slipping to fourth. They’re now as many games ahead of the Pirates as they are behind the Cubs. Baseball Reference gives the Crew just a 21.9% chance to crack the playoffs, and FanGraphs is even more bearish, with a 9.7% chance. If there has ever been a time to sound the alarm, it’s now. At this rate, Milwaukee will almost certainly head into the deadline as sellers. This isn’t a situation where a new bullpen arm and platoon bat can be the difference between success and failure; it really looks like the whole situation is just beyond repair. The team still has more than 100 games to prove me wrong, but so far, they haven’t demonstrated the ability to do so. View full article
-
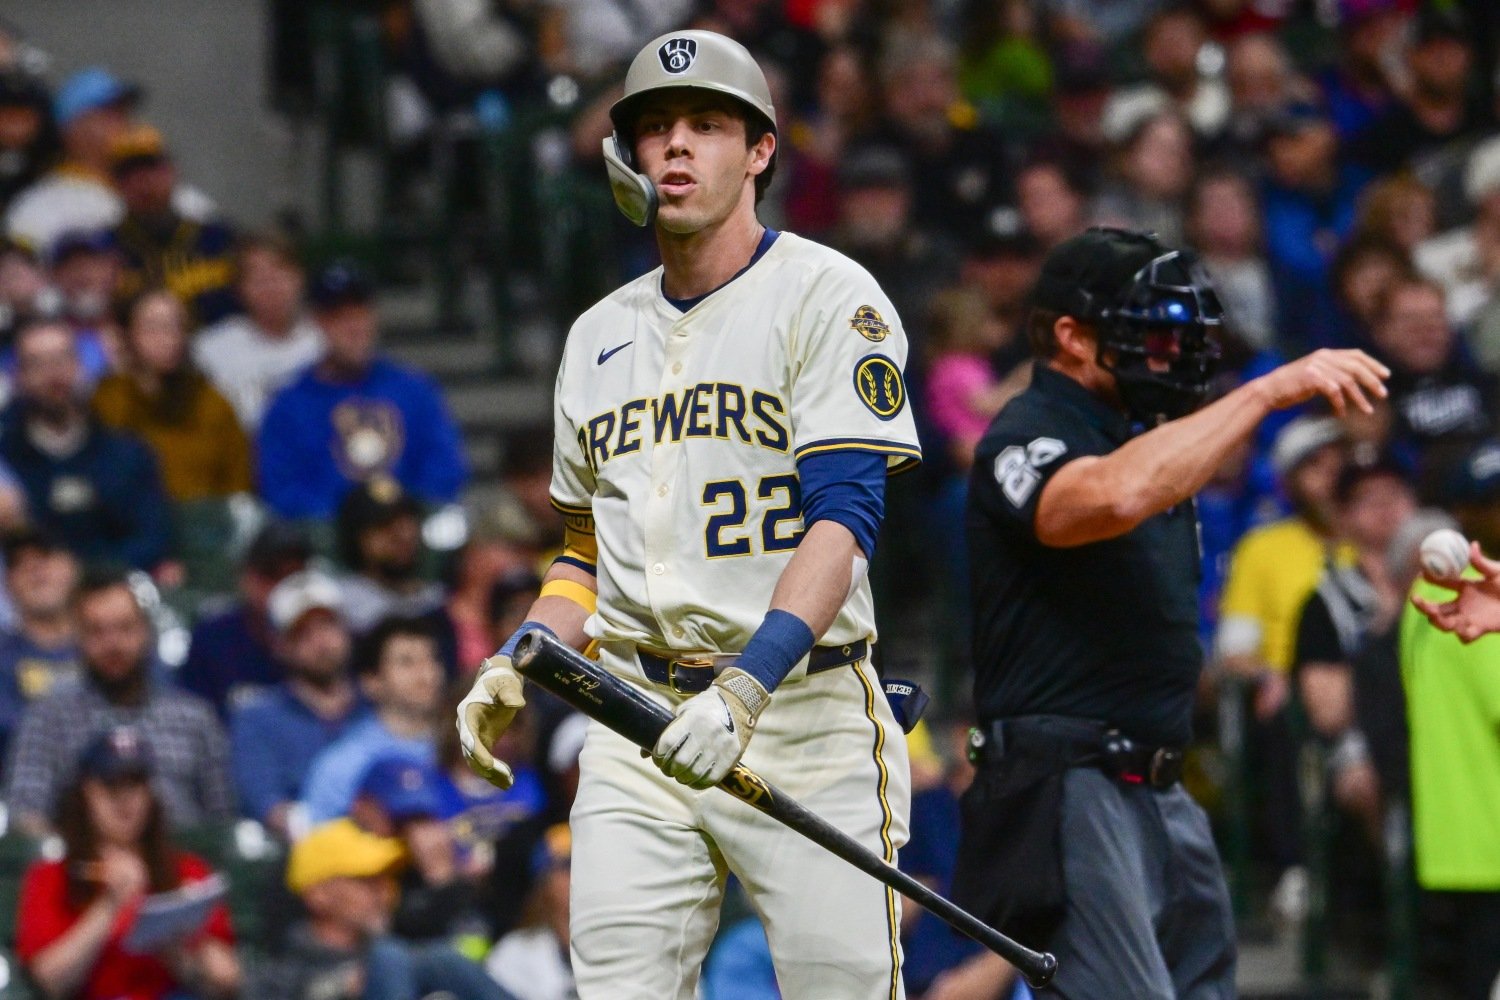 I’m a pretty optimistic guy. Every year, I place three small and separate wagers on Anthony Rendon, Kris Bryant, and José Abreu to win MVP awards. Of course, these bets must be placed with a somewhat shady, unofficial bookmaker, because no gambling platform worth their salt would allow someone to risk money on events with such astronomical odds. I persist in my dogged faith that one of those bets will eventually pay off. Despite my tendency to look on the bright side of life and remain in good spirits about most things, though, even I can say that the Milwaukee Brewers are probably not going to do much of anything this year. This has never been a perfect team, and the budget has rarely come close to eclipsing the league average, but David Stearns's and Matt Arnold’s uncanny abilities to build a winning roster out of a box of scraps has pushed the team to consistent success over the past several years. In 2025, that luck seems to have run out. It was another year of doing barely anything in the offseason, and outside of the Devin Williams trade, the most notable move on the Brewers’ list of transactions may have been Jared Koenig changing his number back to 47. What has been the result of this inaction? The Brewers’ lineup has combined for a .652 OPS, 28th in MLB and better than just the Pirates and White Sox—two teams you hardly want in your peer group. Only three players have more than 100 plate appearances and an wRC+ better than average, while the players who are struggling are doing so with gusto. William Contreras is putting up numbers far worse than his past two years with the team, playing through an injury. Jackson Chourio was making so many mistakes in his approach that he was bumped down in the lineup. In stark contrast with the scorching start he got off to last year, it seems that Christian Yelich’s back problems have returned as a significant impediment to his abilities. But perhaps no one has been as disappointing as Joey Ortiz, who has hit a brick wall after being moved back to his native role of shortstop. Willy Adames left big shoes to fill, but Ortiz initially seemed primed for the task. He had been a top prospect in a stacked Baltimore system, and while imperfect, his first year in Milwaukee was good, culminating in a 104 wRC+ and 3.1 fWAR. In 2025, his wRC+ sits at just 29, and he has been worse than replacement-level overall. Fellow Brewer Fanatic writer Jack Stern did a deeper dive on what might be going wrong (and how the team might address it) in this recent piece. It’s tricky to even skew the stats in a way that would give the lineup any sort of credit. Outside of leading the league in stolen bases, the offensive numbers are pretty lackluster across the board. Here is where they rank in several major hitting statistics compared to the other 29 MLB teams. BA .229 (25th) OBP .306 (22nd) SLG .346 28th R 193 (16th) H 347 (23rd) 2B 59 (25th) HR 37 (26th) SO 379 (16th) OPS vs. LHP .611 (25th) OPS vs. RHP .672 (25th) These problems are now more apparent than ever, with the Crew scoring in just one of their last five games. In fact, they’ve scored more than five runs in just 12 of their 46 contests thus far this season. Not only are they currently trying their best to avoid a sweep at the hands of the Twins, they’re trying to avoid being totally shut out for the entire weekend. Sometimes, a team can compensate for a lack of offense with stellar pitching and defense. The Seattle Mariners had a bottom-bucket offense last year, but their top-tier pitching and good defense carried them to being just a few wins short of a Wild Card spot. Unfortunately, the Brewers can’t really lean on that, either. While these two characteristics have been a strength of the roster in recent years, their combined ERA of 4.19 is 21st in MLB and they rank 16th in total Defensive Runs Saved, with 6. While the Cubs have maintained the strong pace they set to start the season and the Cardinals recently went on a nine-game winning streak, the Brewers have fallen further and further down the NL Central, slipping to fourth. They’re now as many games ahead of the Pirates as they are behind the Cubs. Baseball Reference gives the Crew just a 21.9% chance to crack the playoffs, and FanGraphs is even more bearish, with a 9.7% chance. If there has ever been a time to sound the alarm, it’s now. At this rate, Milwaukee will almost certainly head into the deadline as sellers. This isn’t a situation where a new bullpen arm and platoon bat can be the difference between success and failure; it really looks like the whole situation is just beyond repair. The team still has more than 100 games to prove me wrong, but so far, they haven’t demonstrated the ability to do so.
 -
Image courtesy of © Ken Blaze-Imagn Images After a particularly depressing series against the Yankees, I wrote a satirical piece about Jake Bauers that slightly embellished his accomplishments as a player, as a way of coping with the trauma of being outscored 36-14 in three games. Through a more objective lens, one can point out that Bauers is not exactly what comes to mind when thinking of who can step up to get the Brewers out of their current slump. He has been below replacement in every year of his big-league career, except for his rookie campaign (when he amassed just 0.5 rWAR). It’s hard to be much better than that, when you’re a first baseman with a career 83 OPS+ and average defensive abilities. But this year feels different, and not just because he still has a perfect 0.00 ERA over his four appearances out of the bullpen. Across an admittedly small sample of just 62 plate appearances, he’s slashing .288/.373/.508, for an OPS+ of 145—the highest mark of any player on the team. He kept the exceptional walk rate from last year, but is combining it with a Barrel rate of nearly 20% and a chase rate of just 23.4%. In other words, he’s making good swing decisions and has great quality of contact. That would be the assumption you'd make if you went to his Baseball Savant page and refused to scroll down or click anything. If you take a peek under the hood, you'll find that there's quite a bit to fix. Throughout his career, Bauers has had an issue with swinging and missing. Last year, he whiffed almost 30% of the time, which was a big contributor to his crippling 34.1% strikeout rate. This year, it’s even worse, with a 36.4% whiff and 37.1% strikeout rate. One might ask how a player can have an elite chase rate and still have bottom decile strikeout and whiff rates. The reason is clear: they don't swing at strikes nearly enough. So far, Bauers is swinging just 42.1% of the time, his lowest rate since 2019. Even worse, his zone swing rate of 58.9% is also the lowest it has been in his career. Essentially, he’s very passive at the plate, even when he’s given the chance to do some real damage. His meatball swing rate (a very scientific metric, I know) is just 72.7%, meaning that he’s keeping the bat on his shoulder for over one in four grooved pitches, right down the middle. As for the whiff aspect, it may be a result of reduced confidence in certain parts of the strike zone. It’s definitely not a symptom of swinging at bad pitches. Let’s do some digging as to what his swing/take profile looks like. As we can see, he’s confidently taking swings at pitches inside and in the middle of the zone. The outside is where the timidity really comes in; he’s swinging at fewer than half the pitches he gets in those areas. If we take a look at what happens when he does swing, we see a similar distribution of blue and red. Okay, so let’s assume he threw caution to the wind and let his hands go just a little bit. What would happen? Well, assuming the thesis of this entire article isn’t predicated solely on an anomalous set of 62 plate appearances, we’d probably see a lot of good contact. As mentioned earlier, his barrel rate is nearly 20%, and when we break that down by swings and parts of the strike zone, we see that when he does decide to go for a pitch, he’s usually hitting it pretty well. Given this information, it seems like Bauers is only operating at partial strength, even with an .881 OPS. If he were to take a few more risks and trust in his own ability to differentiate between balls and strikes, we could finally see a breakout after six years in the majors. Aside from his lack of enthusiasm for taking hacks, another problem Bauers is facing is accessibility to playing time. Fellow first baseman Rhys Hoskins has been having a good year himself, posting a 123 OPS+ over a much more robust 149 plate appearances. However, it seems that the Brewers are making a concerted effort to get Bauers into the lineup more often; he has been making far more appearances in the outfield than he did last year. In fact, he has played more innings in the outfield (67 ⅓ innings) than he has first base (56) thus far. This team needs power, anywhere they can get it. Bauers is looking like a possible source, so they're giving him a chance to prove it. It has been a disappointing season for Milwaukee, to say the least. The postseason odds are trending in wrong direction and it’s tempting to throw in the towel now and just wait for 2026 to roll around. However, the Brewers are just four games behind in the Central, and there’s still plenty of baseball to be played. Could Jake Bauers play an ultimately pivotal role in bringing the Crew back to the postseason? Maybe, but he’ll have to take a swing or two first. View full article
-
With More Aggression, Jake Bauers Could Be Powering the Brewers' Offense
Jason Wang posted an article in Brewers
 After a particularly depressing series against the Yankees, I wrote a satirical piece about Jake Bauers that slightly embellished his accomplishments as a player, as a way of coping with the trauma of being outscored 36-14 in three games. Through a more objective lens, one can point out that Bauers is not exactly what comes to mind when thinking of who can step up to get the Brewers out of their current slump. He has been below replacement in every year of his big-league career, except for his rookie campaign (when he amassed just 0.5 rWAR). It’s hard to be much better than that, when you’re a first baseman with a career 83 OPS+ and average defensive abilities. But this year feels different, and not just because he still has a perfect 0.00 ERA over his four appearances out of the bullpen. Across an admittedly small sample of just 62 plate appearances, he’s slashing .288/.373/.508, for an OPS+ of 145—the highest mark of any player on the team. He kept the exceptional walk rate from last year, but is combining it with a Barrel rate of nearly 20% and a chase rate of just 23.4%. In other words, he’s making good swing decisions and has great quality of contact. That would be the assumption you'd make if you went to his Baseball Savant page and refused to scroll down or click anything. If you take a peek under the hood, you'll find that there's quite a bit to fix. Throughout his career, Bauers has had an issue with swinging and missing. Last year, he whiffed almost 30% of the time, which was a big contributor to his crippling 34.1% strikeout rate. This year, it’s even worse, with a 36.4% whiff and 37.1% strikeout rate. One might ask how a player can have an elite chase rate and still have bottom decile strikeout and whiff rates. The reason is clear: they don't swing at strikes nearly enough. So far, Bauers is swinging just 42.1% of the time, his lowest rate since 2019. Even worse, his zone swing rate of 58.9% is also the lowest it has been in his career. Essentially, he’s very passive at the plate, even when he’s given the chance to do some real damage. His meatball swing rate (a very scientific metric, I know) is just 72.7%, meaning that he’s keeping the bat on his shoulder for over one in four grooved pitches, right down the middle. As for the whiff aspect, it may be a result of reduced confidence in certain parts of the strike zone. It’s definitely not a symptom of swinging at bad pitches. Let’s do some digging as to what his swing/take profile looks like. As we can see, he’s confidently taking swings at pitches inside and in the middle of the zone. The outside is where the timidity really comes in; he’s swinging at fewer than half the pitches he gets in those areas. If we take a look at what happens when he does swing, we see a similar distribution of blue and red. Okay, so let’s assume he threw caution to the wind and let his hands go just a little bit. What would happen? Well, assuming the thesis of this entire article isn’t predicated solely on an anomalous set of 62 plate appearances, we’d probably see a lot of good contact. As mentioned earlier, his barrel rate is nearly 20%, and when we break that down by swings and parts of the strike zone, we see that when he does decide to go for a pitch, he’s usually hitting it pretty well. Given this information, it seems like Bauers is only operating at partial strength, even with an .881 OPS. If he were to take a few more risks and trust in his own ability to differentiate between balls and strikes, we could finally see a breakout after six years in the majors. Aside from his lack of enthusiasm for taking hacks, another problem Bauers is facing is accessibility to playing time. Fellow first baseman Rhys Hoskins has been having a good year himself, posting a 123 OPS+ over a much more robust 149 plate appearances. However, it seems that the Brewers are making a concerted effort to get Bauers into the lineup more often; he has been making far more appearances in the outfield than he did last year. In fact, he has played more innings in the outfield (67 ⅓ innings) than he has first base (56) thus far. This team needs power, anywhere they can get it. Bauers is looking like a possible source, so they're giving him a chance to prove it. It has been a disappointing season for Milwaukee, to say the least. The postseason odds are trending in wrong direction and it’s tempting to throw in the towel now and just wait for 2026 to roll around. However, the Brewers are just four games behind in the Central, and there’s still plenty of baseball to be played. Could Jake Bauers play an ultimately pivotal role in bringing the Crew back to the postseason? Maybe, but he’ll have to take a swing or two first.


