wiguy94
-
Posts
8,281 -
Joined
-
Days Won
117
Content Type
Profiles
Forums
Blogs
Events
Milwaukee Brewers News, Rumors & Analysis
2026 Milwaukee Brewers Top Prospect Rankings
Milwaukee Brewers Videos
2022 Milwaukee Brewers Draft Picks & Signing Bonuses
Milwaukee Brewers Trade & Free Agent Rumors
Milwaukee Brewers Fan Guides & Resources
2023 Milwaukee Brewers Draft Picks & Signing Bonuses
2024 Milwaukee Brewers Draft Picks & Signing Bonuses
The Milwaukee Brewers Players Project
2025 Milwaukee Brewers Draft Picks & Signing Bonuses
2026 Milwaukee Brewers Draft Picks & Signing Bonuses
Store
Downloads
Gallery
Everything posted by wiguy94
-
Woody having season ending shoulder surgery
wiguy94 replied to markedman5's topic in Milwaukee Brewers Talk
Woodruff entering this year was at 7.161 years of service time so after this year he will need 1 year and 11 days of service time to hit that 10 year mark. -
Woody having season ending shoulder surgery
wiguy94 replied to markedman5's topic in Milwaukee Brewers Talk
Maybe I'm wrong but I don't think professional athletes are weighing convenience when it comes who they let operate on their body. -
That's on the pitching side not the hitting side. Baseball-reference derives pitching WAR through runs allowed while fangraphs derives pitching WAR through FIP. The position player side typically has gaps because baseball-reference weights defense much more heavily than fangraphs does and they use different measurements to evaluate defense. Baseball-reference uses DRS and fangraphs uses OAA/FRV. For reference this is Caleb Durbin's value by b-ref and fangraphs this year B-ref - -2 runs batting, +2 runs baserunning, +9 runs fielding, +2 runs positional adjustment which is 11 runs above average plus 12 runs adjusting from average to replacement. That leaves him 23 runs better than replacement for 2.3 bWAR Fangraphs - -4 runs batting, +1.9 runs baserunning, +3.6 runs fielding, +1.3 runs positionally, they have +1.7 run adjustment to league average then plus 10.4 runs adjusting from average to replacement. That leaves him 14.9 runs better than replacement for 1.5 fWAR. So Durbin has 0.8 more bWAR than fWAR and defensively baseball reference has him 6.1 runs better than fangaphs does defensively so 75% of the gap between the two comes from defensive value. This is why Turang had a huge gap between bWAR and fWAR in 2024. DRS viewed him as +22 and FRV viewed him as +5. Bref viewed his defense as worth 27 runs and fangraphs as worth 5.6 runs which is how one ends up with 4.8 bWAR and 2.6 fWAR.
-
The Bregman contract is going to be fun to look back on over the next few years because him signing that contract with the Cubs indirectly led to us getting Kyle Harrison and Shane Drohan.
-
Woody having season ending shoulder surgery
wiguy94 replied to markedman5's topic in Milwaukee Brewers Talk
I'm sure the reasoning will never see the light of day but Woodruff changing his doctors for this second surgery feels notable to me. -
Really nice to see him cut down on the strikeouts. I was looking at the team ACL numbers a couple days ago and basically the entire lineup was striking out over 30% on the year outside of the promoted Frias and Martinez
- 2 replies
-
- 1
-

-
- cristopher acosta
- brailyn antunez
- (and 4 more)
-
Gasser threw 135 innings in 2023. He's at 78 right now so no he's not close to having thrown more innings this year than he has in the prior three seasons.
-
Also Nesbitt followed up his tweet. Clearly seems to be talking about how much winning the Brewers are doing
-
I think we can put the rumors to rest. If the Brewers were actually extending someone their social media team wouldn't be referencing that Nesbitt tweet.
-
That's just a random fan
-
Mets (Peralta) vs Brewers (Misiorowski): 7/20/26, 6:40pm
wiguy94 replied to Brock Beauchamp's topic in Archived Game Threads
Hey I had your back on that one! -
You literally already said Peralta is over 5 IP/start in this thread which is why I brought up those other pitchers... "I'm not arguing he’s awesome but you’re slicing the numbers in a misleading way to make your point. Peralta coming into tonight has made 20 starts and pitched 104.1 innings. That’s technically a hair over 5ip/start. Outside of Miz the Brewers don’t have a pitcher averaging more than 5IP/start either."
-
Mets (Peralta) vs Brewers (Misiorowski): 7/20/26, 6:40pm
wiguy94 replied to Brock Beauchamp's topic in Archived Game Threads
I appreciate the effort you put into your posts but I think posting team records before and after Yelich began leading off is misleading because the before sample includes a large portion where Vaughn and Chourio were hurt and this team really took off when those two got healthy. Brewers were 13-5 between Chourio and Vaughn coming back on 5/4 and Yelich being moved to leadoff on 5/26. -
Gasser and Drohan both have 10 GS, 51.1 IP. That's over 5 IP/start. Henderson not counting him being an opener in Kansas City before he was stretched out is at 6 GS, 31.1 IP. That's over 5 IP/start. Harrison has had two injury shortened starts. If you take those out he's averaging over 5 IP per start at 15 GS, 76.2 IP
-
Mets (Peralta) vs Brewers (Misiorowski): 7/20/26, 6:40pm
wiguy94 replied to Brock Beauchamp's topic in Archived Game Threads
He had one bad series. He has a 104 wRC+ in July while under performing his xwOBA by 36 points. -
I'd guess just that the Brewers are once again one of the best teams in baseball. I don't think Nesbitt is some guy that breaks news. Also he tweets all lower case a bunch. I scrolled back like 10 tweets and there were multiple all lower case tweets.
-
Mets (Peralta) vs Brewers (Misiorowski): 7/20/26, 6:40pm
wiguy94 replied to Brock Beauchamp's topic in Archived Game Threads
Vaughn is in the lineup so people need to find a new person to complain about not being in the lineup. -
I think Fischer is just messing around. Long bus ride from Biloxi to Chattanooga today.
-
I think that's way too steep for 10 starts of even Skubal.
-
How can you confidently say Kelly would be useful when he’s never thrown a big league inning?
-
I still think a vet SP is the biggest need and if you add one of those it also makes the bullpen look stronger with one of Gasser, Drohan, or Sproat shifting into the pen.
-
BA came out with their new post draft Top 30 lists assuming all round 1-10 picks sign. Strosnider at 18 (They bumped him down from a 60 high/45 to a 55 high/40) Ebel at 19 Jones at 23 Garcia at 24
-
Sun. 7/19: Mix in a DSL All-Star Box, Please!
wiguy94 replied to Jim Goulart's topic in Brewers Minor League Talk
Wagoner with a 1-2-3 inning with a strikeout and two can of corn flyouts in his first AAA inning. His FB sat 97 in the inning and topped out at 98.6. High spin at 2400rpm on the FB and the two breaking balls he threw were around 2900mph -
Marlins (Perez) vs Brewers (Gasser): 7/19/26, 1:10pm
wiguy94 replied to Brock Beauchamp's topic in Archived Game Threads
The issue was he was trying to pull it for damage. Murphy preaches letting the game come to you. Turang wasn't letting the game come to him there he was trying to make something happen in a scenario where that was completely not needed. If he's not trying to get out in front of that and pull it he probably can hold up and get the count to 3-0. -
Marlins (Perez) vs Brewers (Gasser): 7/19/26, 1:10pm
wiguy94 replied to Brock Beauchamp's topic in Archived Game Threads
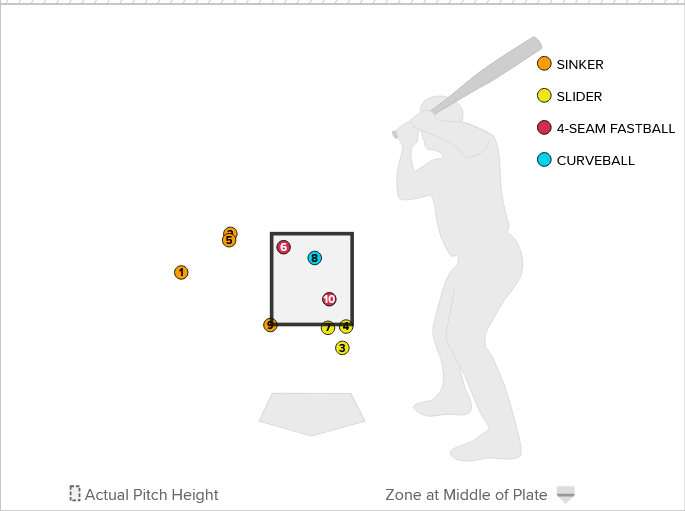
It was well below the zone after the first two pitches weren't even close to the zone.